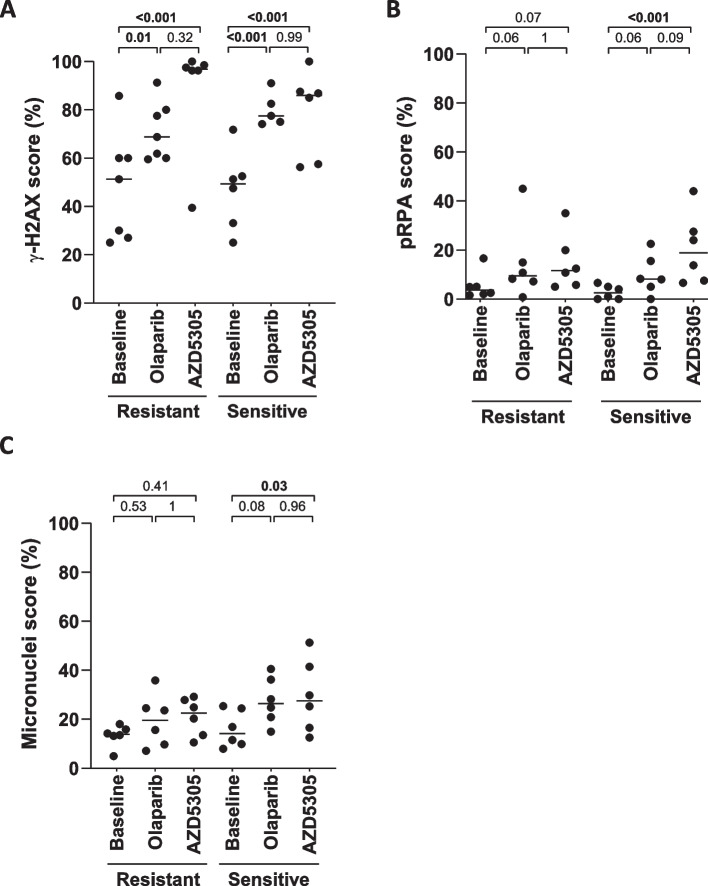
Fig. 4.
Biomarkers of DNA damage and replication stress in PDX models. Quantification of the percentage of tumor cells A in S/G2-phase (geminin-positive) with γ-H2AX nuclear foci, B in S/G2-phase (geminin-positive) with phospho-RPA nuclear foci, or C with at least one micronucleus in AZD5305-resistant (n = 6) and sensitive (n = 6) available PDX models, untreated or treated for 12 days with olaparib 100 mg/kg and AZD5305 1 mg/kg. Black lines indicate the biomarker mean of each group. p values (linear mixed-effects models) are indicated with significant values labeled in bold

