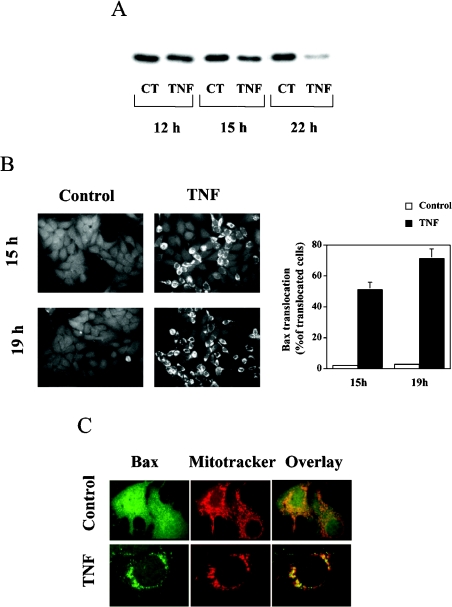
Figure 1. TNFα-induced mitochondrial translocation of Bax in MCF7 cells.
(A) Western blot analysis of cytosolic extracts (5 μg) from control (CT) and TNFα-treated (TNF) cells after 12, 15 and 22 h of incubation. Cells (1.7×10⁶) were treated with TNFα (3 nM) for the indicated times, and cytosolic extracts for analysis of Bax levels were obtained as described in the Experimental section. (B) Immunocytochemical analysis of Bax in control and TNFα-treated cells. Cells (1.7×10⁶) were treated with TNFα (3 nM) for the indicated times, and analysis of Bax localization by indirect immunofluorescence was performed as described in the Experimental section. A clear translocation of Bax was observed after 15 h of TNFα treatment. The punctate pattern was more pronounced after 19 h of treatment. Ten to 15 random fields from each experimental condition were counted, and the percentage of cells that showed translocation of Bax over the total number of counted cells is represented in the histogram. Results are means±S.D. for three different experiments. (C) Localization of Bax after TNFα treatment. Cells (1.7×10⁶) were treated with TNFα (3 nM) for 15 h. At 20 min before fixation, the cells were incubated with 25 nM MitoTracker Red, and analysis of Bax localization and mitochondrial patterns were performed as described in the Experimental section.

