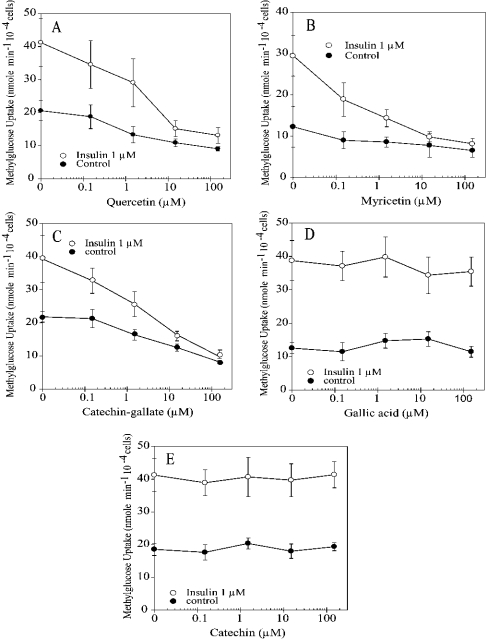
Figure 3. Effect of flavonoids on methylglucose uptake by rat adipocytes.
Dose–response curves for (A) quercetin, (B) myricetin, (C) catechin-gallate, (D) gallic acid and (E) catechin on the transport of methylglucose, measured as uptake in 30 s, in the presence (○) or absence (●) of 1 μM insulin. Results are expressed as percentage of transport in the absence of flavonoids and shown as the means±S.D. for four samples.

