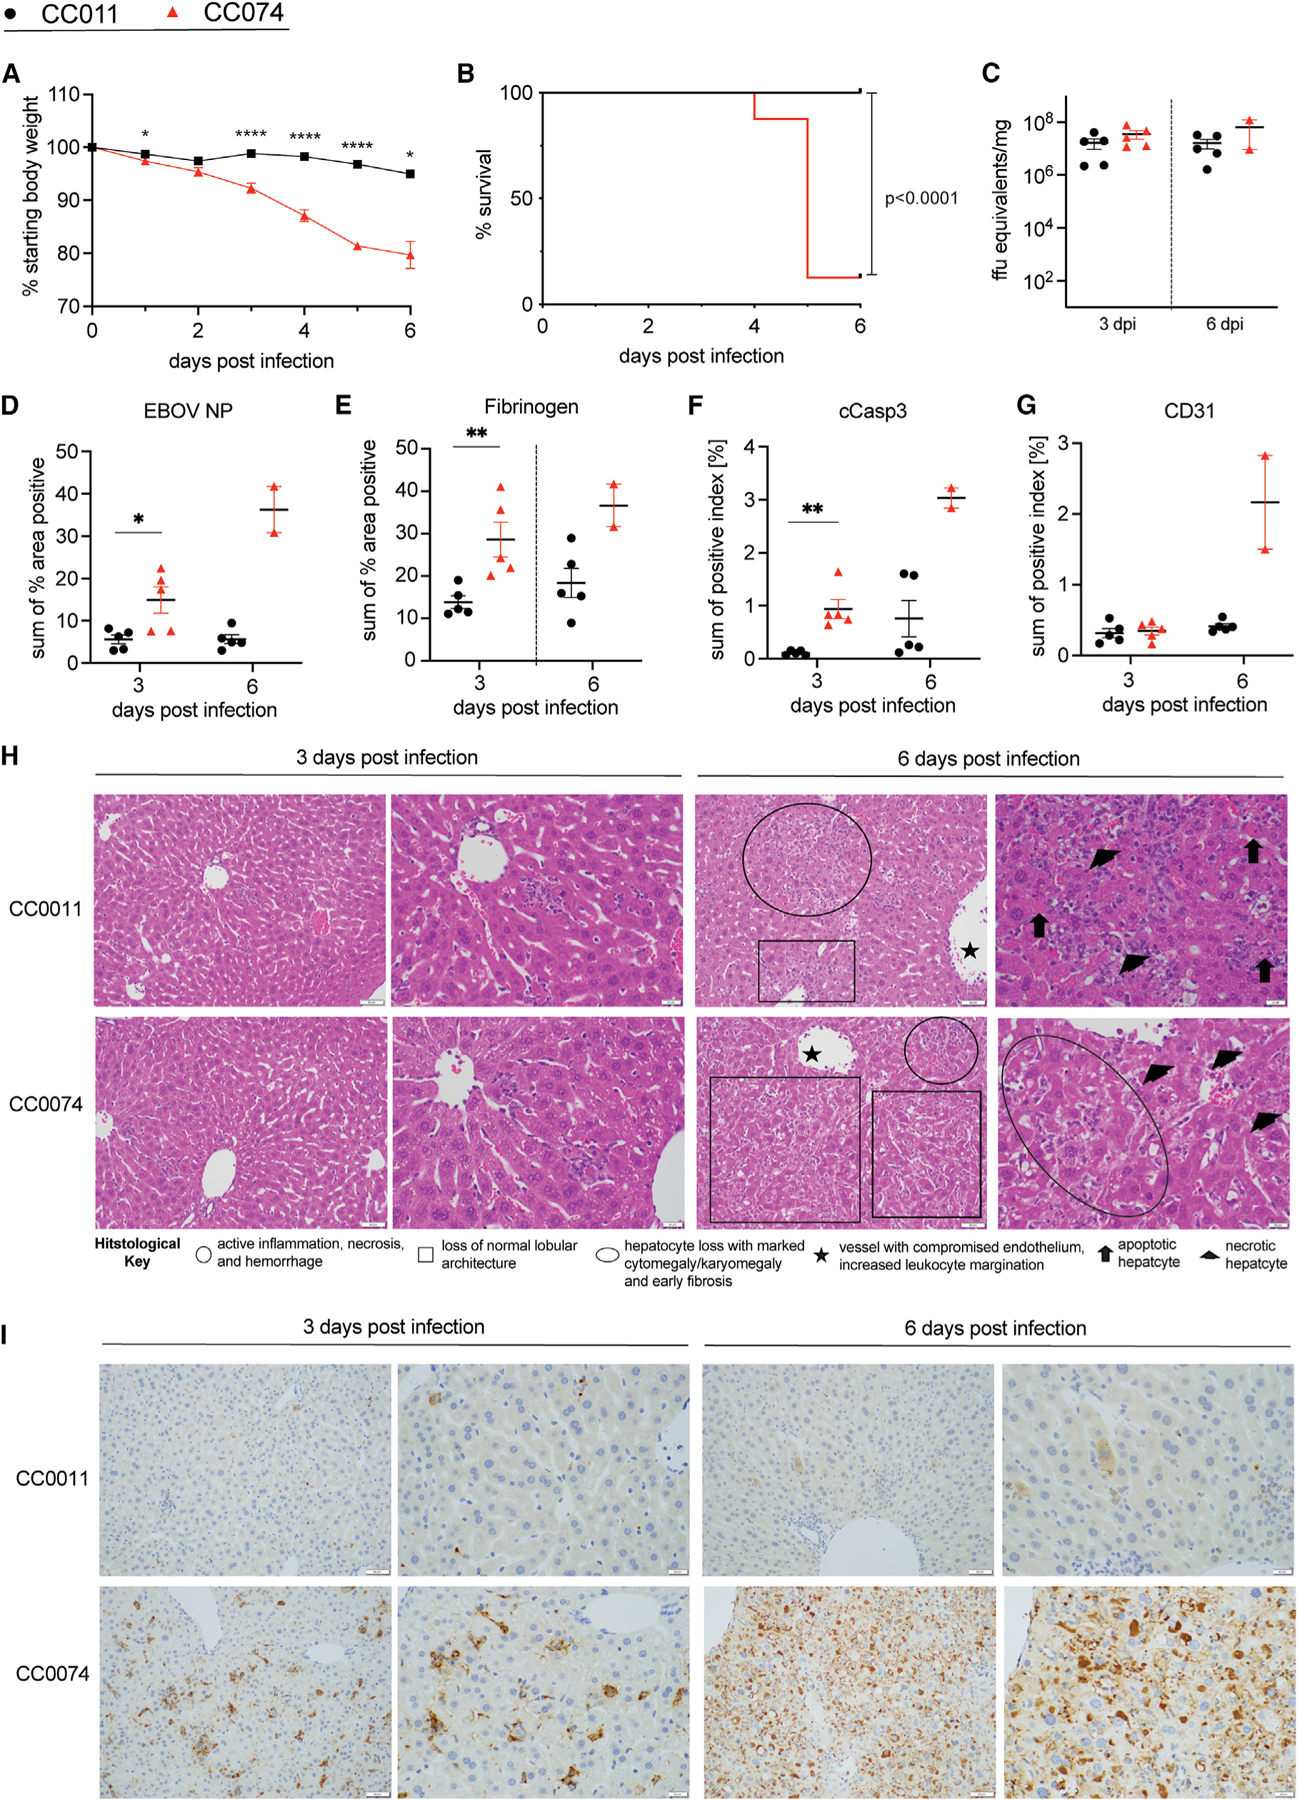
Figure 2. Characterization of EBOV infection in the two parental strains, CC011 and CC074.

(A and B) Age-matched CC011 and CC074 mice (n = 16 each, 8–10 weeks, both sexes) were infected with 100 ffu MA-EBOV and mice were monitored daily for weight loss (A) and mortality (B).
(C–G) (C) Groups of CC011 and CC074 were used to evaluate the viral load in the liver (n = 5 female for all, except n = 2 males for CC074 on 6 dpi). Liver samples of matched mice from (C) were then used for quantification by IHC staining of (D) EBOV NP, (E) fibrinogen, (F) cleaved caspase 3, and (G) CD31 in the liver.
(H and I) Representative images (20× and 40×, respectively) of the (H) hematoxylin and eosin (H&E)-stained liver sections and (I) EBOV nucleoprotein-immunostained liver sections utilized for the histological assessment of differences between CC011 and CC074 at 3 and 6 dpi; scale bars, 50 μm. Data were analyzed using Mann-Whitney test (weight loss, liver titer, histological quantification) and log rank test (survival). Significance is indicated as *p < 0.05, **p < 0.005, and ****p < 0.0001.
