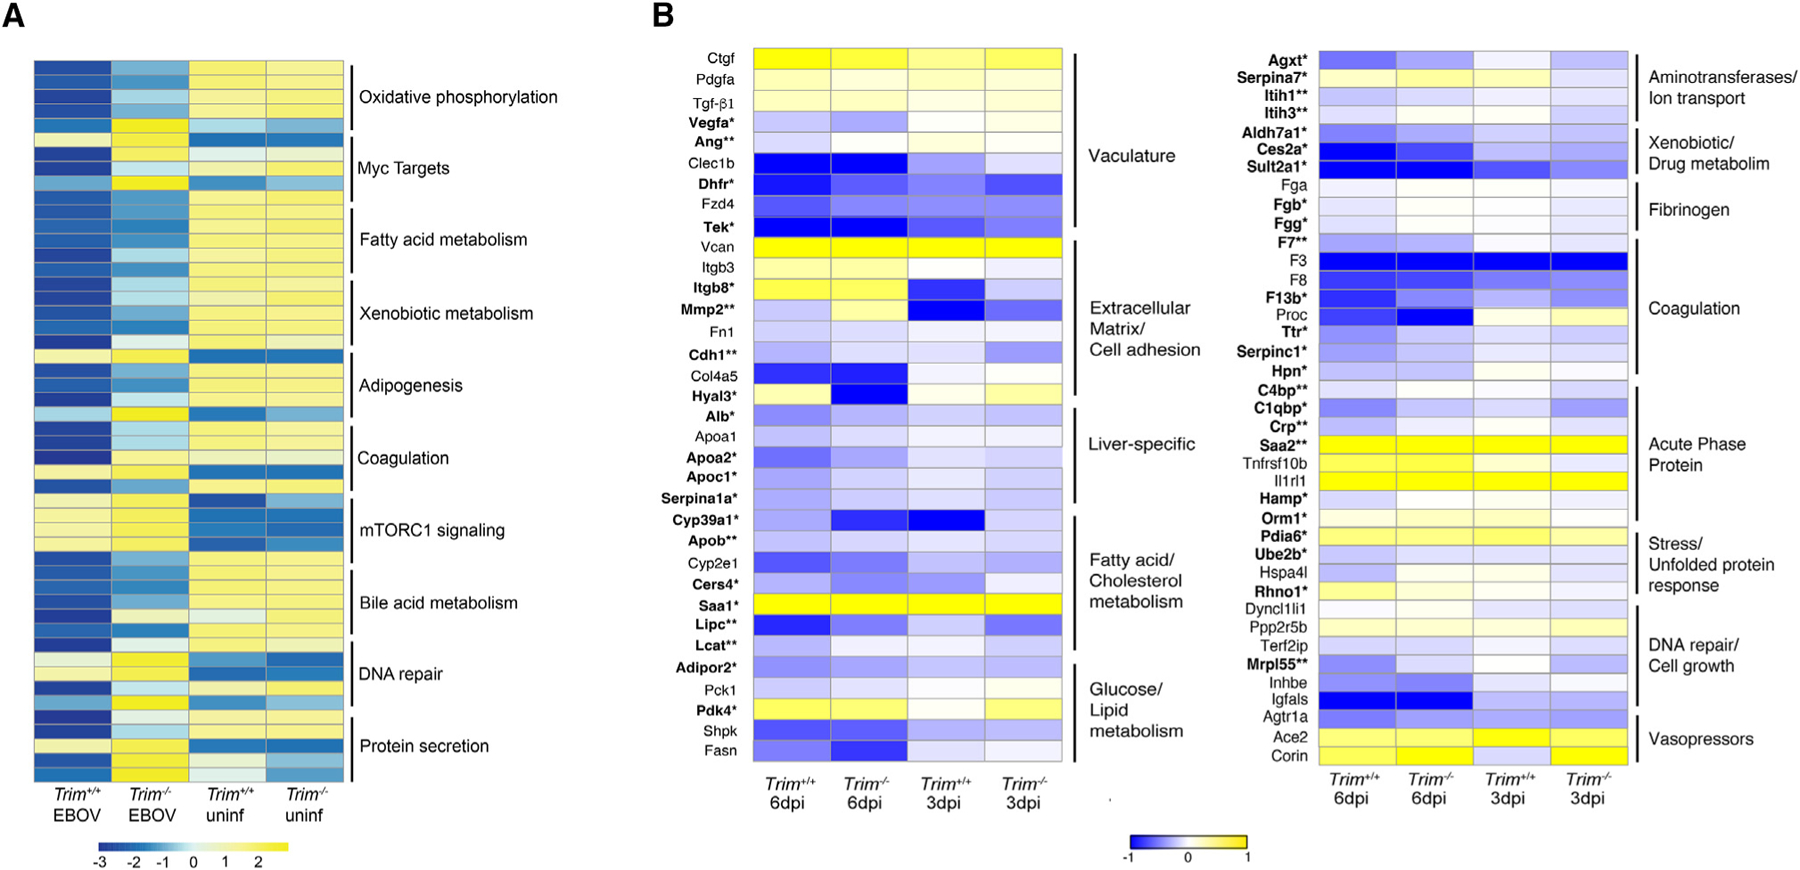
Figure 6. Differentially expressed gene signatures in the liver in Trim+/+ and Trim−/− mice.

(A) Heatmap of the top five ranked genes in the top 10 significantly enriched pathways in infected Trim+/+ and Trim−/− mice compared to their respective mock-infected controls (<1.5 log2 fold over mock; p < 0.05); shown are the average expression levels for each gene for each group on 6 dpi (n = 5 females for all time points, n = 3 females for all time points for mocks).
(B) Heatmap of key genes being significantly affected during the development of EVD-like disease in the liver (in bold). For each gene, the average normalized transcript counts (log2 cpm.) are shown. Data were analyzed using Mann-Whitney test; significance is indicated as p* < 0.05, **p < 0.005 (n = 5 EBOV-infected females for all time points, n = 3 mock-infected females for all time points).
