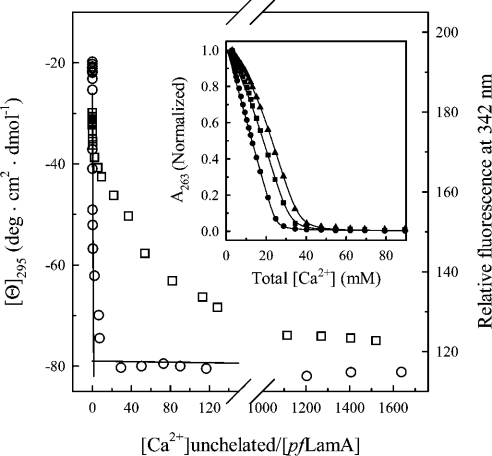
Figure 2. Interaction of calcium with pfLamA.
[Θ]295 (○, 22 μM pfLamA in 7.9 M GdmCl) and fluorescence intensity at 342 nm (□, 1.2 μM pfLamA in 7.9 M GdmCl) were measured from near-UV CD and fluorescence spectra (290 nm excitation wavelength) recorded at 20 °C, 5 min after each Ca2+ addition. [Θ]295 is reported after removal of the high-frequency noise and the low-frequency random error by SVD. The two limiting slopes, calculated by non-linear regression analysis to the [Θ]295 data at 22 μM pfLamA, intersect at a point corresponding to [Ca2+ unchelated]/[pfLamA]=2. The reported unchelated Ca2+ concentrations, calculated according to [30], are 0.2 nM–35.0 mM and 0.2 nM–1.82 mM for [Θ]295 and fluorescence changes respectively. The inset shows a plot of the decrease in 5,5′-Br2-BAPTA A263 towards [Ca2+] in the absence (●) and presence of 10 μM (■) and 20 μM (▲) native pfLamA in 10 mM Tris/HCl (pH 7.5) at 20 °C. The solid lines represent fitting of the data by non-linear analysis using the CaLigator software [21].

