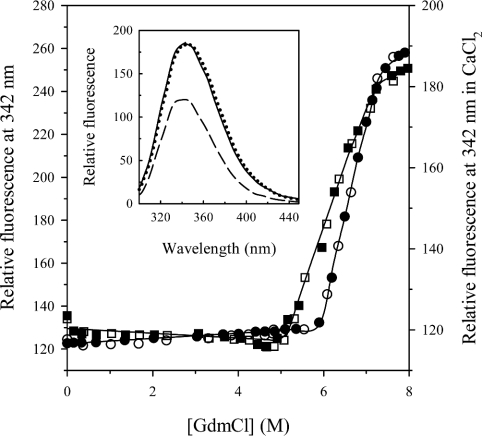
Figure 4. Effect of calcium on the GdmCl-induced fluorescence changes of pfLamA.
Relative fluorescence emission intensity at 342 nm (290 nm excitation wavelength) was recorded at 20 °C after 24 h incubation at varying denaturant concentrations, in the absence (●, left axis) and presence of 40 mM CaCl2 (■, right axis), as described in the text (see the Experimental section). Continuous lines are the non-linear regressions to eqn (2) of the fluorescence data. The reversibility points (empty symbols) were not included in the non-linear regression analysis. Inset: the intrinsic fluorescence emission spectra of pfLamA in 7.9 M GdmCl and 40 mM CaCl2: —–, the spectrum measured after 24 h incubation in 7.9 M GdmCl in the presence of 40 mM CaCl2;……, the spectrum resulting from the progressive addition of CaCl2 to the protein after 24 h incubation in 7.9 M GdmCl; –––, the spectrum of the native pfLamA in 20 mM Tris/HCl (pH 7.4). All the spectra were recorded at 20 °C.

