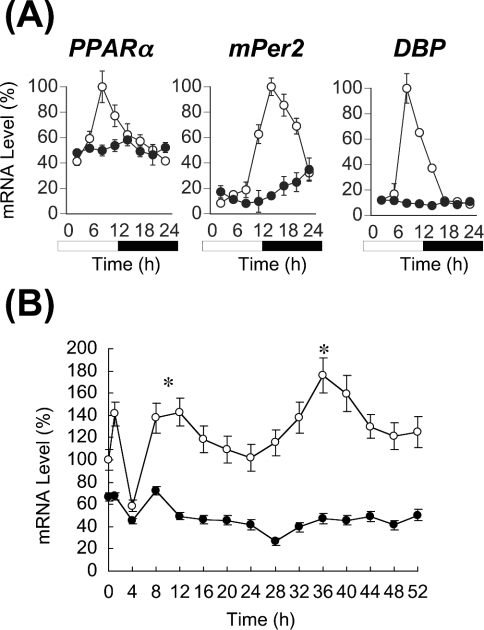
Figure 1. CLOCK-dependent circadian expression of PPARα mRNA in vivo and in vitro.
(A) Expression of PPARα, mPer2 and DBP mRNAs in the liver of wild-type (○) and homozygous Clock mutant (●) mice. mRNA levels of genes were quantified from Northern blots. Maximal values of wild-type mice are expressed as 100% in each gene. Open bar, lights on; closed bar, lights off. Results are means±S.E.M. (n=3). Representative Northern blots are shown in Supplementary Figure 1(A) at http://www.BiochemJ.org/bj/386/bj3860575add.htm. (B) Circadian expression of PPARα mRNA in MEFs from wild-type (○) and homozygous Clock mutant (●) mice. At zero time, cells were stimulated with ET-1. After 2 h, medium was replaced with DMEM containing 5% FBS. Results were normalized by comparison with amount of GAPDH (glyceraldehyde-3-phosphate dehydrogenase). Initial value of wild-type MEFs is expressed as 100%. Results are means±S.E.M. (n=3). One-way ANOVA demonstrated a significant rhythmicity of PPARα mRNA levels in wild-type MEFs (P<0.05). Asterisks indicate peaks of rhythmically expressed PPARα mRNA. Representative Northern blots are shown in Supplementary Figure 1(B) at http://www.BiochemJ.org/bj/386/bj3860575add.htm.

