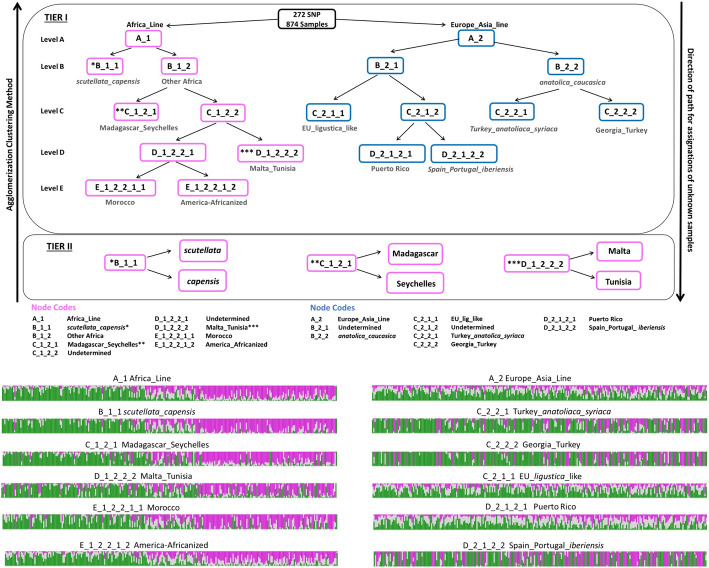
Fig. 4.
Visualization of hierarchical clustering. Diagram illustrating the agglomerative hierarchical clustering performed, using SNP genotypes, for the development of the Knowledge Base Network used to form HBeeID. Labels indicate the position of the respective groups and the level at which they clustered. The proportional graphs below show the genotype profile of honey bee samples for the 272 SNPs for selected nodes. The length of the bars represents the proportion of 0 (Green), 1 (Gray), or 2 (Pink) genotype in the honey bee samples that comprise each node. The higher the bar the higher the proportion of the corresponding state

