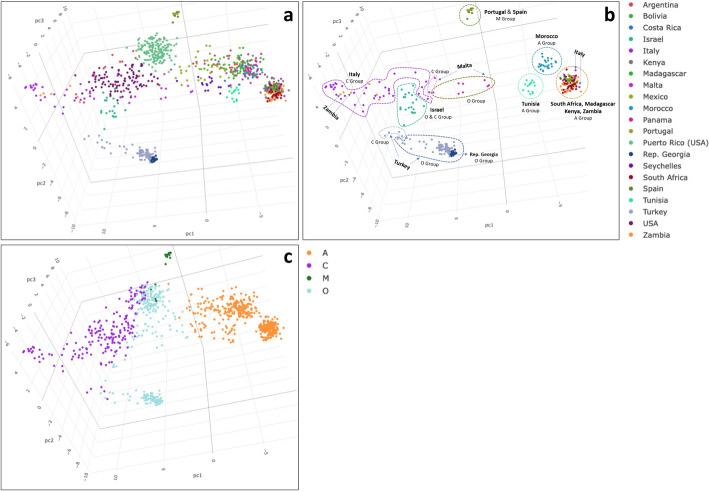
Fig. 5.
a, b, c. a Genotypic relationship of honey bee samples. PCA plot generated using 874 HB samples genotyped with 272 SNPs using the Fluidigm genotyping platform. The reader is encouraged to see the interactive 3D version of this figure available to download in the supplementary section as Additional file 5_3D interactive plot and on github or Additional file 5 (html interface). b PCA plot of a subset of all samples from Africa, Italy, Malta, Israel, the Iberian Peninsula, Turkey, and the Republic of Georgia demarcated as per the HB group assignation given when using reference set III. c PCA of HB samples identified as per their assignation to the A, C, M, or O groups obtained in the GeneClass2 analysis run with reference set III

