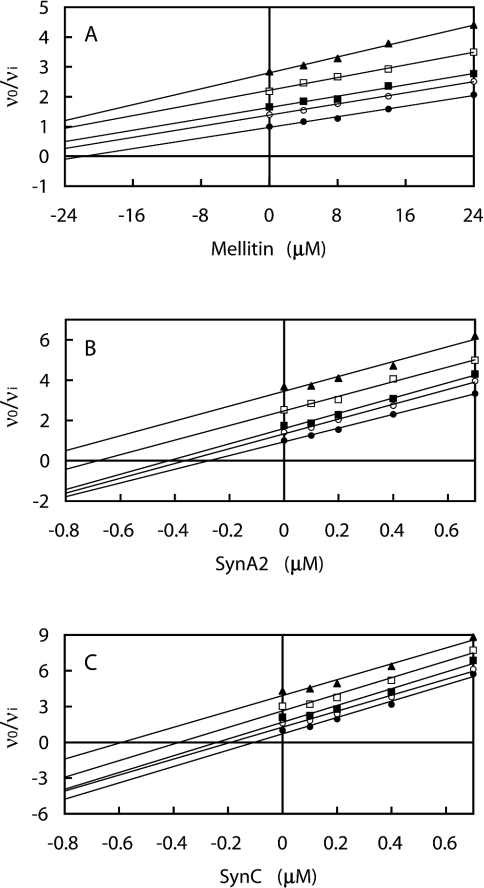
Figure 1. Effect of the combination of IF1 and the amphiphilic α-helical peptides melittin (A), SynA2 (B) and SynC (C) on bovine F1-ATPase.
The series of parallel straight lines evident in the Yonetani–Theorell plots [30] indicates mutually exclusive binding. The concentrations of I1 (melittin, SynA2 or SynC) are shown on the abscissa, and those of I2 (IF1) are: (●) 0 μM, (○) 0.1 μM, (■) 0.2 μM, (□) 0.5 μM, (▲) 1.0 μM. Linear regression lines are drawn through the data points. Each point on the graphs is independent of all others. The use of at least 20 points is sufficient to determine the nature of the interaction between multiple inhibitors. The slight deviation from absolute parallel lines at higher inhibitor concentrations is insignificant, the data are consistent with mutual exclusivity.

