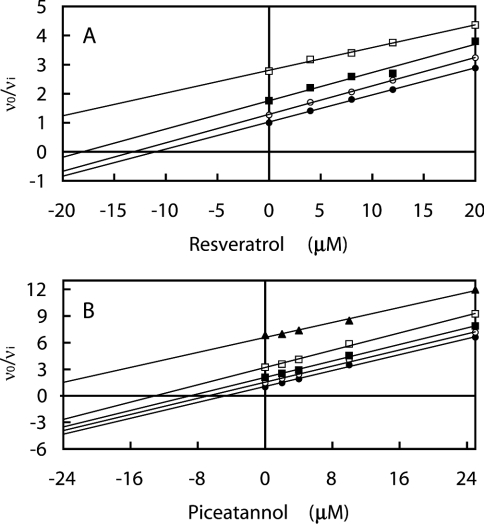
Figure 2. Effect of the combination of aurovertin B and the polyphenolic phytochemicals resveratrol (A) and piceatannol (B) on bovine F1-ATPase.
The series of parallel straight lines evident in the Yonetani–Theorell plots [30] indicates mutually exclusive binding. The concentrations of I1 (piceatannol or resveratrol) are shown on the abscissa, and those of I2 (aurovertin B) are: (●) 0 μM, (○) 0.05 μM, (■) 0.125 μM, (□) 0.25 μM, (▲) 0.625 μM (data using 0.625 μM aurovertin B in combination with resveratrol were not determined). Linear regression lines are drawn through the data points; for further details, see the legend for Figure 1.

