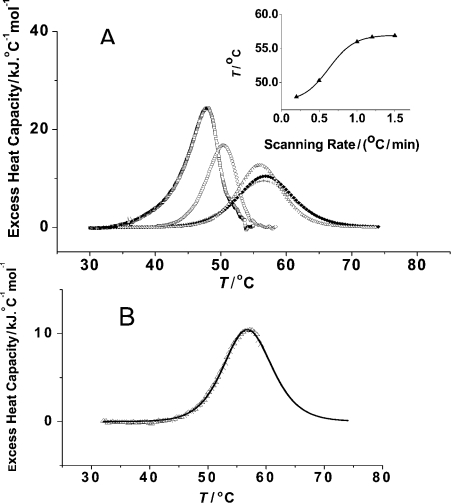
Figure 1. DSC thermograms of wild-type ferrochelatase.
(A) Effect of scan rate on melting temperature (Tm). The thermal denaturation of ferrochelatase (15 μM) was monitored in Bicine buffer (see the Experimental section for details). DSC thermograms were obtained at different scan rates: (□), 0.2 K/min (Tm=49.8 °C); (○), 0.5 K/min (Tm=50.3 °C); (Δ), 1 K/min (Tm=56.0 °C); (▲), 1.2 K/min (Tm=56.7 °C); (+), 1.5 K/min (Tm=56.9 °C). The shown DSC curves result from baseline subtraction of the original thermograms (see the Experimental section). Inset: plot of Tm versus heating rate. (B) Analysis of the unfolding of ferrochelatase in bicine buffer. Protein concentration was 15 μM, and the scan rate 1 °C/min. Buffer corrected results were normalized to protein concentration, and thereafter the native baseline was subtracted, so as to calculate excess heat capacity. The experimental data are shown as open triangles and the continuous line represents the fitted line to the ‘non-two-state’ option, with one transition (see the Experimental and Results and discussion sections for further details of the analysis).

