
Fig. ED10: Myt1l maintains neuronal identity by repression of non-neuronal programs.
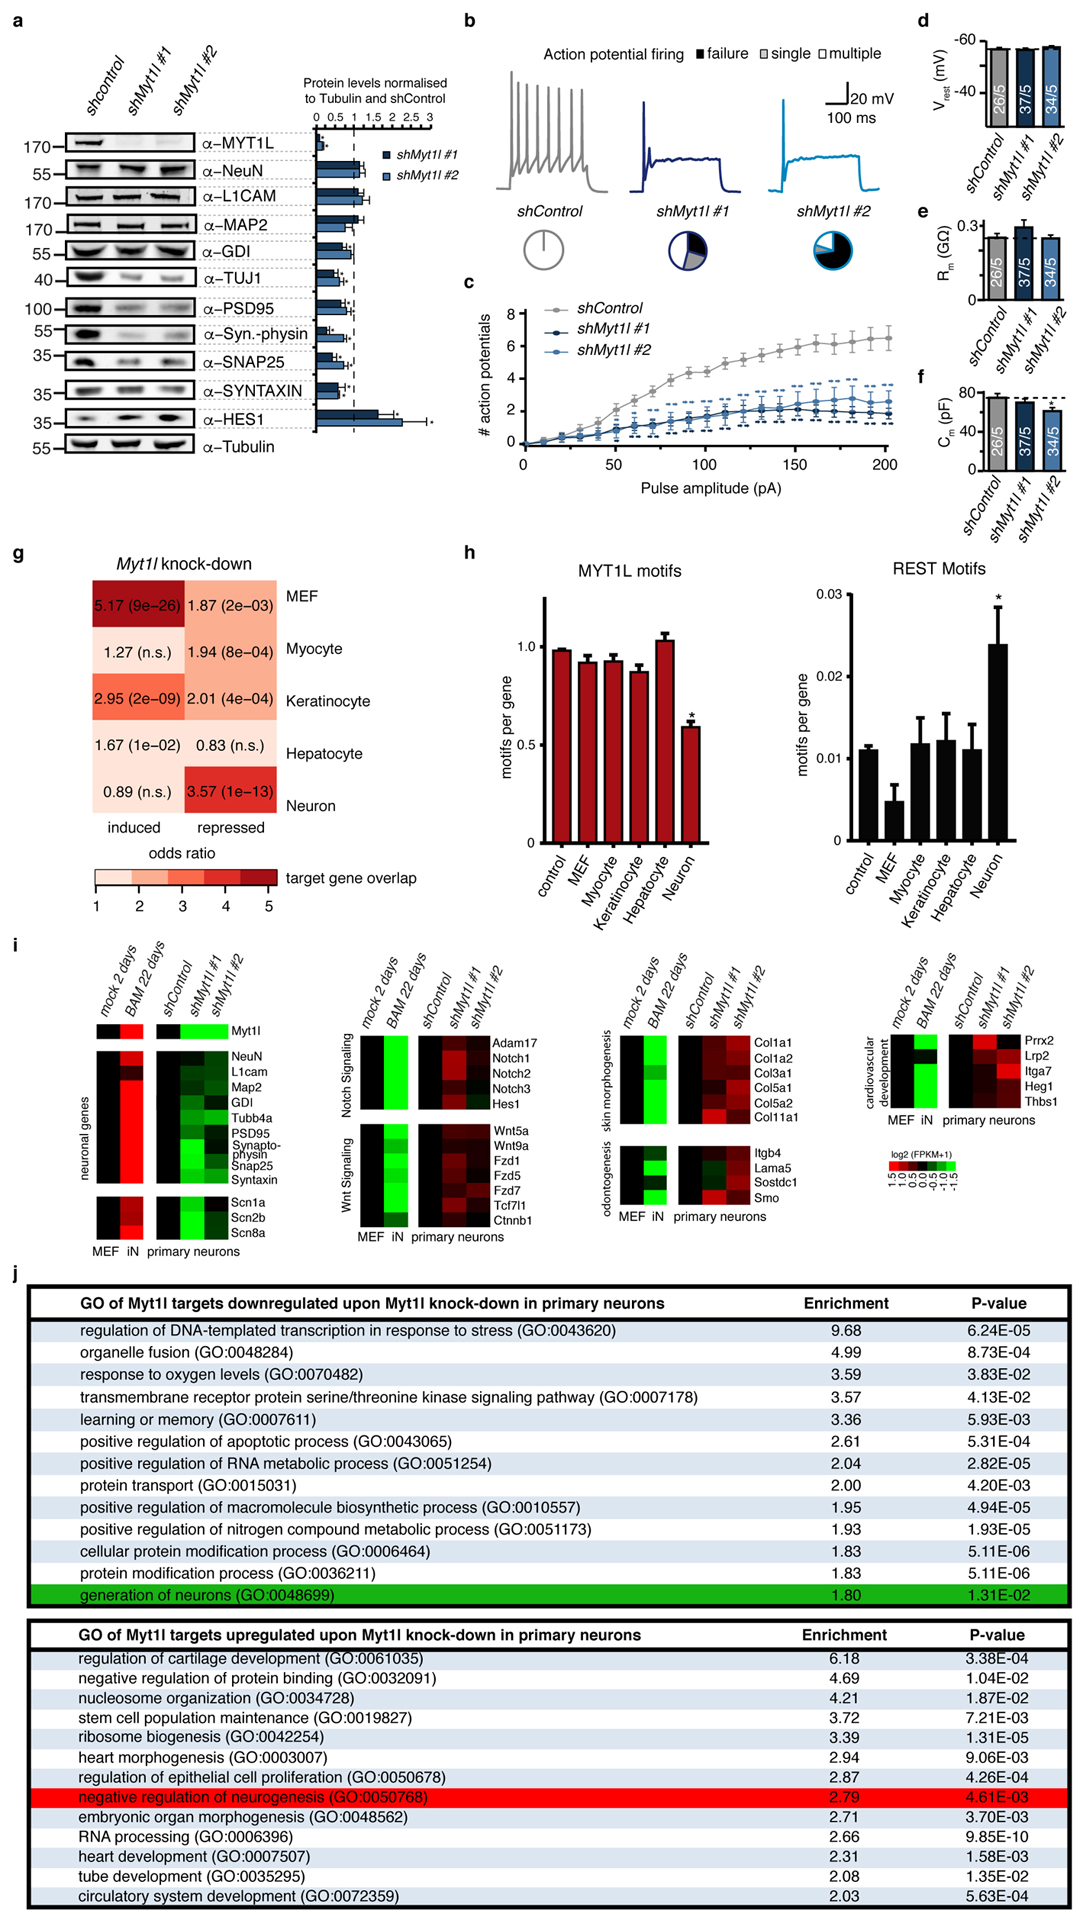
a, Myt1l knock-down in P0 mouse primary hippocampal neuronal cultures impairs neuronal maturation and maintenance. Cells were infected with shRNA-expressing lentivirus on third day of in vitro culture and analysed 11 days later by quantitative Western blot using indicated antibodies. While Tubulin served as loading control several neuronal markers are severely down-regulated by Myt1l depletion. Representative Western blot images are shown, n = 5, error bars = SEM, t-test * p < 0.05. b-f, Electrophysiological characterisation of Myt1l knock-down neurons derived in A. b, Representative action potential (AP) traces of hippocampal neurons upon indicated knock-down, pie charts indicate fraction of cells firing single (grey), multiple (white), or no (black) APs at the 90 pA pulse. c , Mean number of APs fired plotted with respect to pulse amplitude measured at −60 mV holding potential. d, Mean resting membrane-potential (Vrest). e, Mean membrane resistance (Rm) and f capacitance (Cm) measured at −70 mV holding potential. Dotted line indicates intrinsic properties upon shControl treatment, n = 5 biological replicates (total number of individual cells measured indicated), error bars = SE, t-test * p < 0.05. g, Myt1l knock-down in P0 mouse primary hippocampal neuronal cultures induces non-neuronal gene expression programs. Overlap of Myt1l bound target genes that are induced or repressed upon knock down of Myt1l in primary hippocampal neurons and indicated cell type specific expression signatures determined by GeneOverlap27. Odds ratio > 2 represents strong association, p-values are shown, n.s. = not significant. h, Relative number of Myt1l and REST DNA binding motifs at cell type specific genes highlight depletion of Myt1l and enrichment of REST motifs at neuronal genes, respectively (t-test * p < 0.005). i, RNA-seq analysis of genes shown in A, confirm decreased expression of neuronal genes upon Myt1l depletion. In addition several Notch and Wnt signaling factors that are direct targets of Myt1l are de-repressed (see also Fig. 2c). In addition transcription of several non-neuronal lineage specifiers is induced compared to the control. Shown are gene expression values of cells treated as in A based on RNA-seq, fold change is represented in logarithmic scale normalised to the shControl sample, n = 2. j, Selected top gene ontology (GO) terms of Myt1l targeted genes that are repressed (top) or induced (bottom) upon knock-down in primary hippocampal neurons determined by PANTHER28. Enrichment scores and p-values are shown. Highlighted are the terms “generation of neurons” (green) in the repressed cluster and “negative regulation of neurogenesis” (red) and in the induced cluster. In addition this analysis highlights induction of several non-neuronal gene expression programs upon Myt1l depletion.