
Fig. 2: Myt1l target gene repression dominates induced neurogenesis.
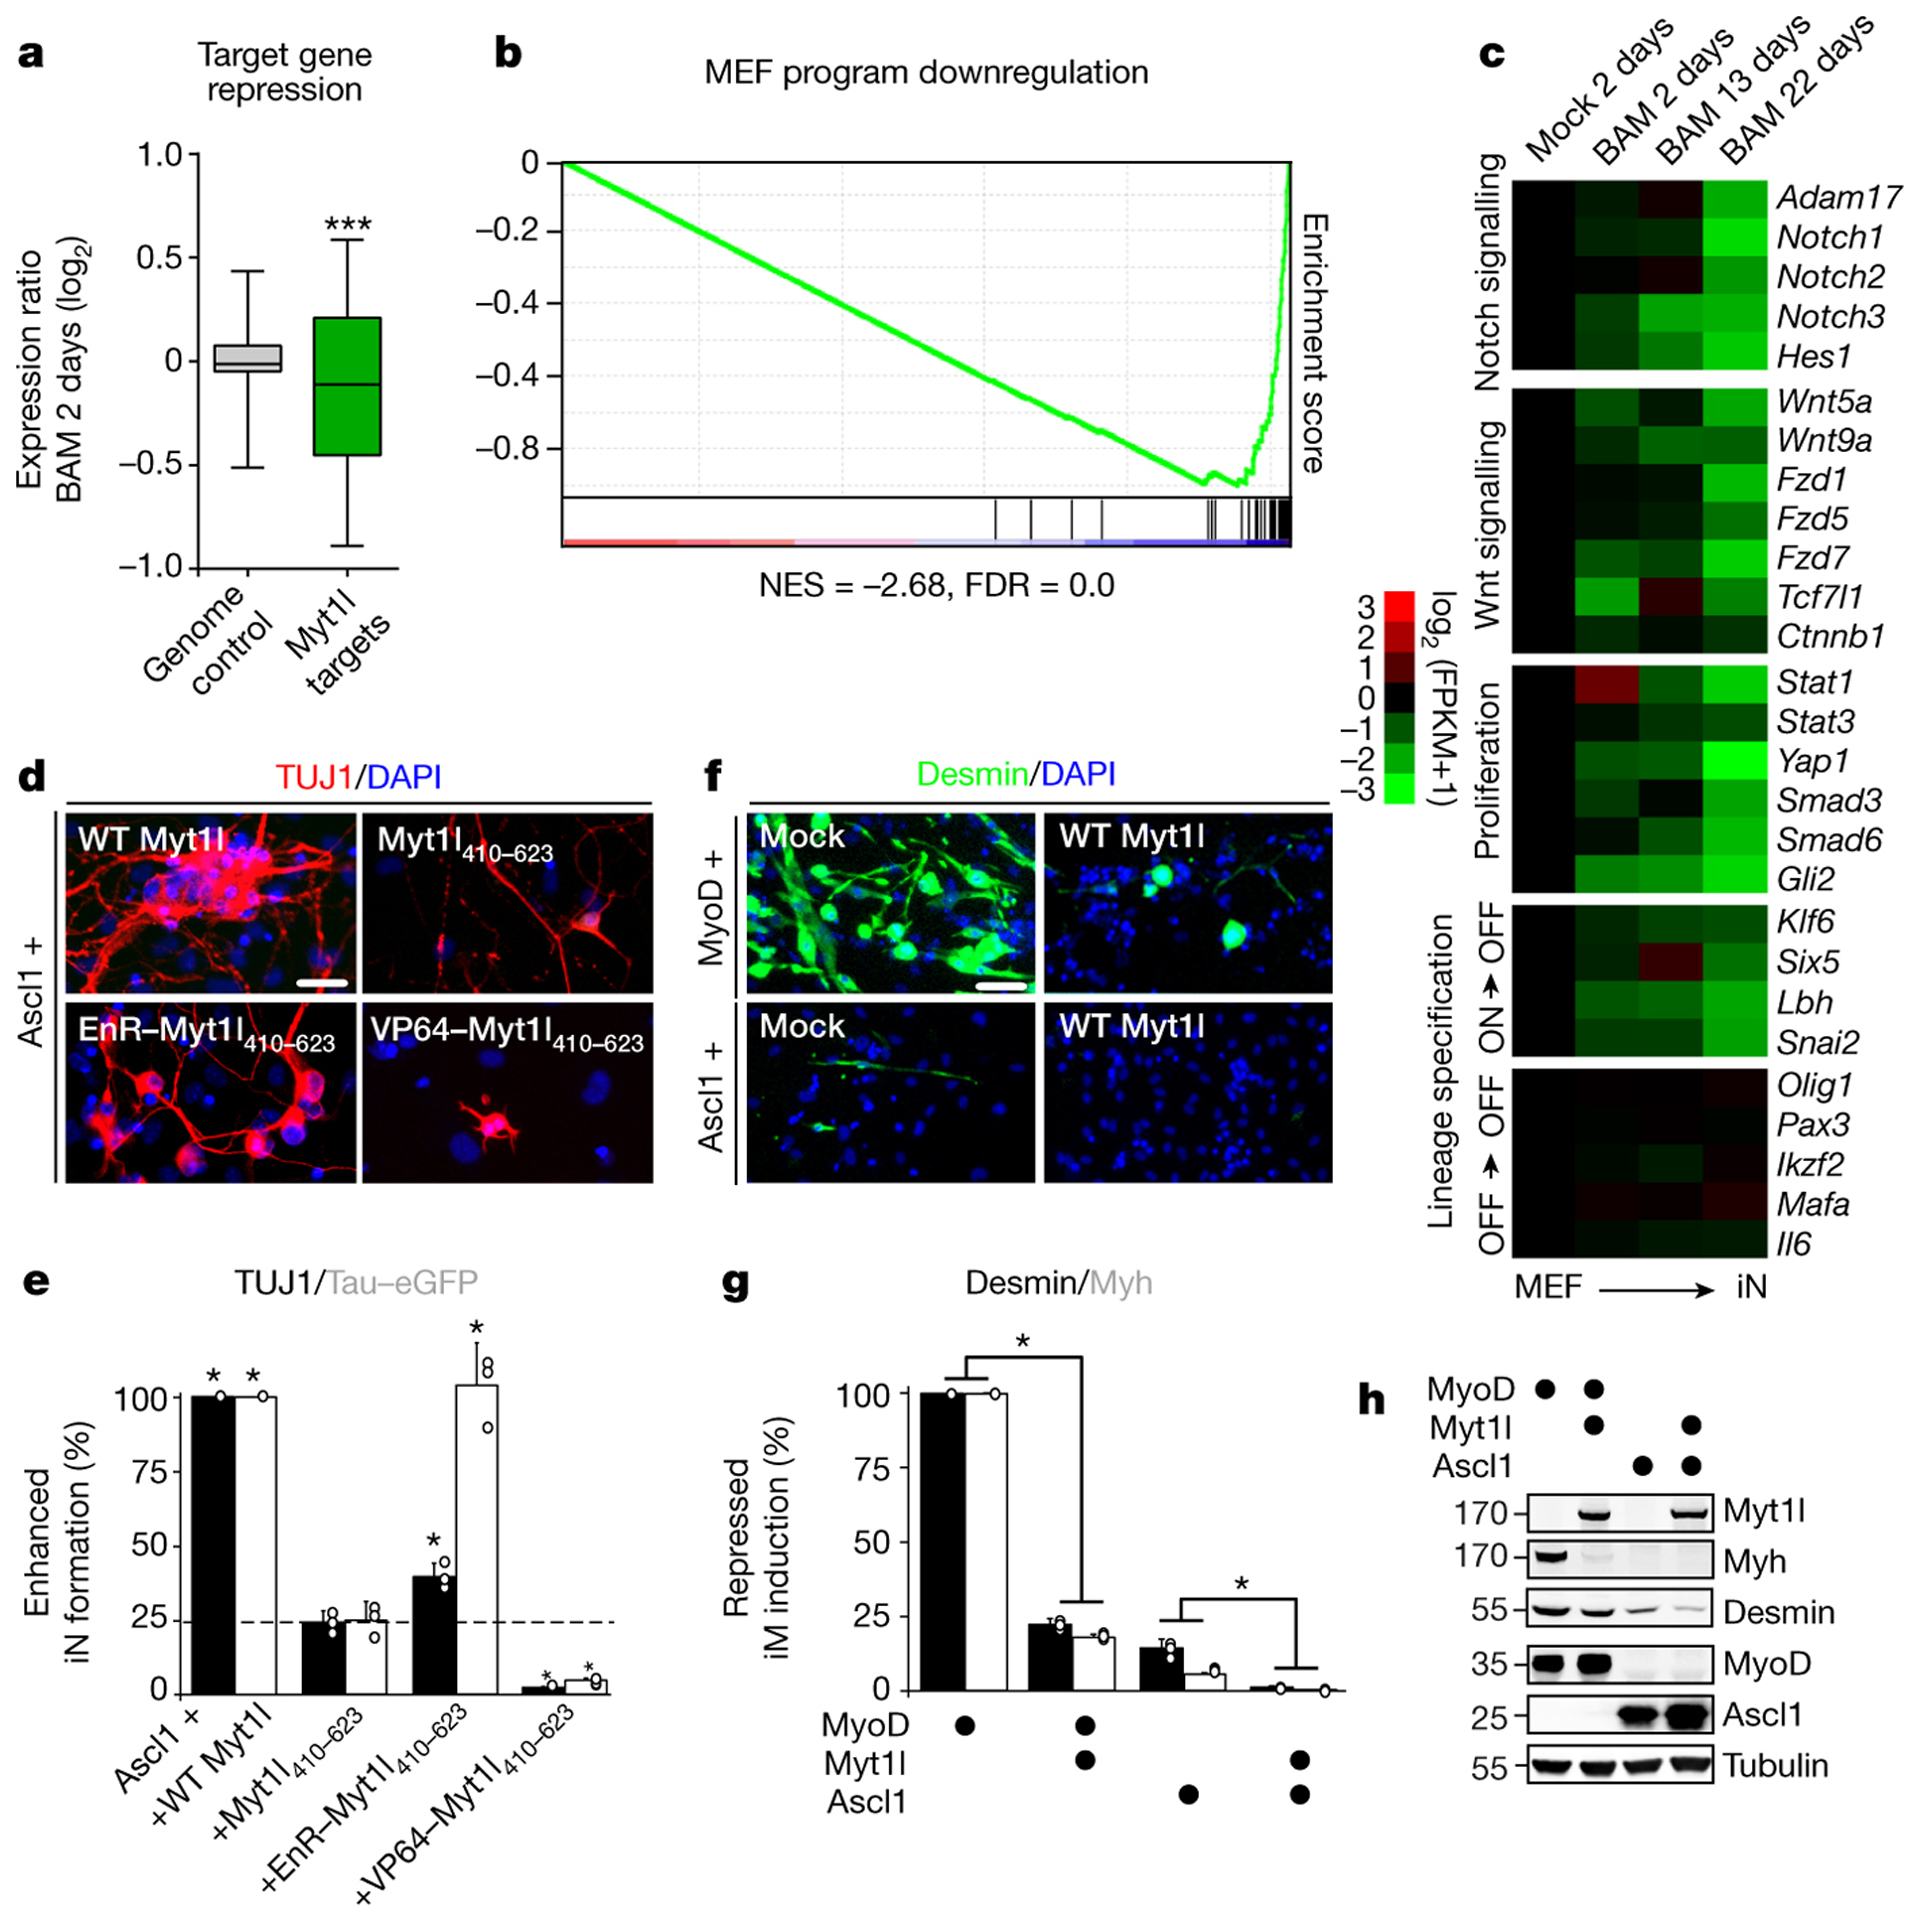
a, Repression of promoter bound (TSS −5,+2kb) Myt1l targets (n = 1798) dominates genome wide expression changes (n = 33459) upon two days of reprogramming (p = 2.78×10⁻¹²), two biological replicates each8. b, GSEA identified MEF signature among repressed Myt1l targets. Normalised enrichment score (NES) and false discovery rate (FDR). c, RNA-seq expression values of selected Myt1l targets at indicated time points during reprogramming, normalised to the mock sample, n = 28. Myt1l represses several Notch, Wnt, and proliferation factors. Many lineage specifiers are bound and repressed (ON->OFF) or remain repressed (OFF->OFF). d, Immunofluorescence of iN cells derived from MEFs upon reprogramming for 14 days with Ascl1 and Myt1l wt or a non-functional zinc finger fragment fused to a repressor (EnR) and activator (VP64); TUJ1 (red), DAPI staining (blue). e, Conversion efficiency of cells shown in D based on TUJ1-positive cells with neuronal morphology (black) or TauEGFP expression (grey) show partial reprogramming using repressor fusion, with many TauEGFP-positive cells without neuronal morphologies. f, Immunofluorescence of MEFs upon reprogramming for 14 days with Ascl1 or MyoD without (mock) or with Myt1l wt; DESMIN (green), DAPI staining (blue). g, Induced muscle (iM) conversion efficiency of cells shown in F based on either DESMIN (black) or MYH expression (grey) show decreased muscle marker-positive cells upon Myt1l wt addition. h, Western blot analysis of cells shown in F after two days of reprogramming using indicated antibodies (gel source data Fig. S1). d-g, Scale bar 50 μm, n = 3, error bars = SD, t-test * p < 0.05.