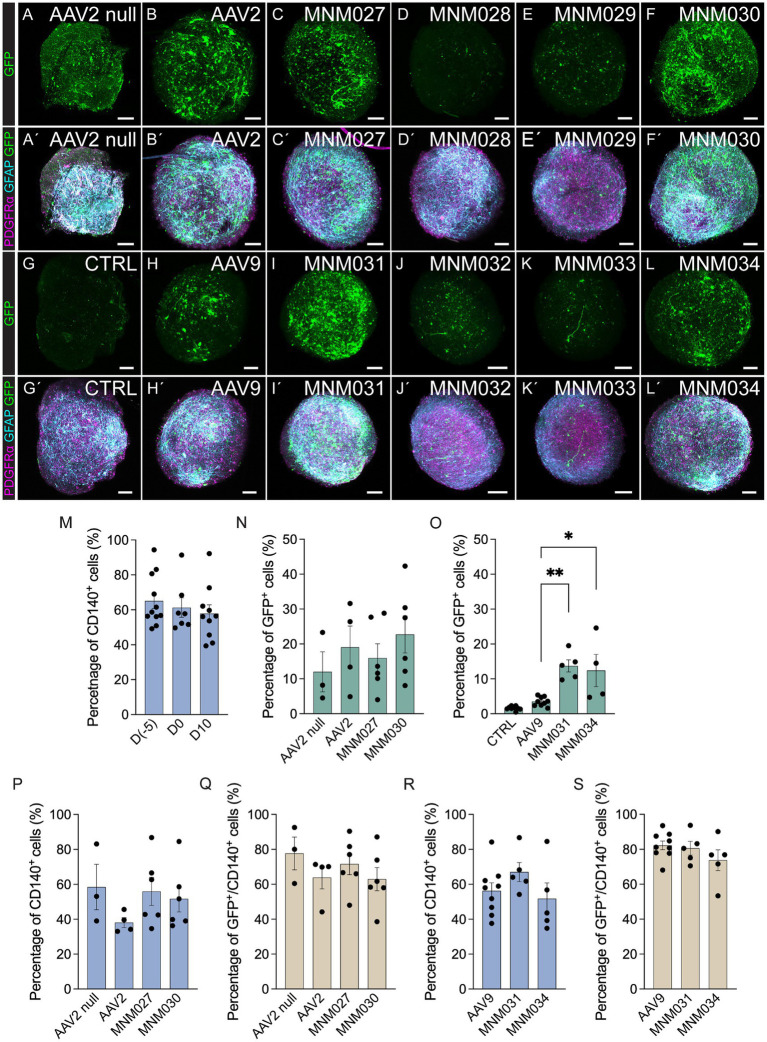
Figure 2.
In vitro validation of AAV capsid variants at D10 post-transduction. (AA´–LL´) Representative immunofluorescence pictures of optically cleared whole glial spheroids expressing GFP (A–L) and glial markers (PDGFRα, GFAP) together with GFP (A´–L´) after transduction using de novo identified capsid variants (CC´–FF,´II´–LL´) and respective wild-type AAVs (BB´,HH´) compared to untransduced control (GG´) and AAV2 null (AA´). The images represent maximum intensity projections. (M) Flow cytometry-based quantifications indicating the proportion of total CD140+ within glial cells at D(−5), glial spheroids at D0 prior to transduction, and untransduced glial spheroids at D10 of analysis. (N–S) Flow cytometry-based quantifications indicating the percentage of total GFP+ (N,O), CD140+ (P,R), and CD140+/GFP+ cells (Q,S) within glial spheroids transduced using novel capsid variants and parental serotypes. Data information: data are presented as means ± SEM, and all data points have been visualized in the graphs. Each data point represents a biological replicate (D(−5) n = 11; D0 n = 7; D10 n = 10; AAV2 null n = 3; AAV2 n = 4; MNM027 n = 6; MNM030 n = 6; AAV9 n = 9; MNM031 n = 5; MNM034 n = 4–5). One-way ANOVA non-parametric Kruskal-Wallis tests and follow-up multiple comparisons with uncorrected Dunn’s test are reported for all quantifications. ∗p ≤ 0.05 and ∗∗p ≤ 0.01 are shown; p > 0.05 is not shown. In (O) exact p = 0.0002, p = 0.0021 for AAV9 versus MNM031, p = 0.0153 for AAV9 versus MNM034. In (N,O), AAV2 null and CTRL are excluded from statistical analysis. Scale bars 100 μm.

