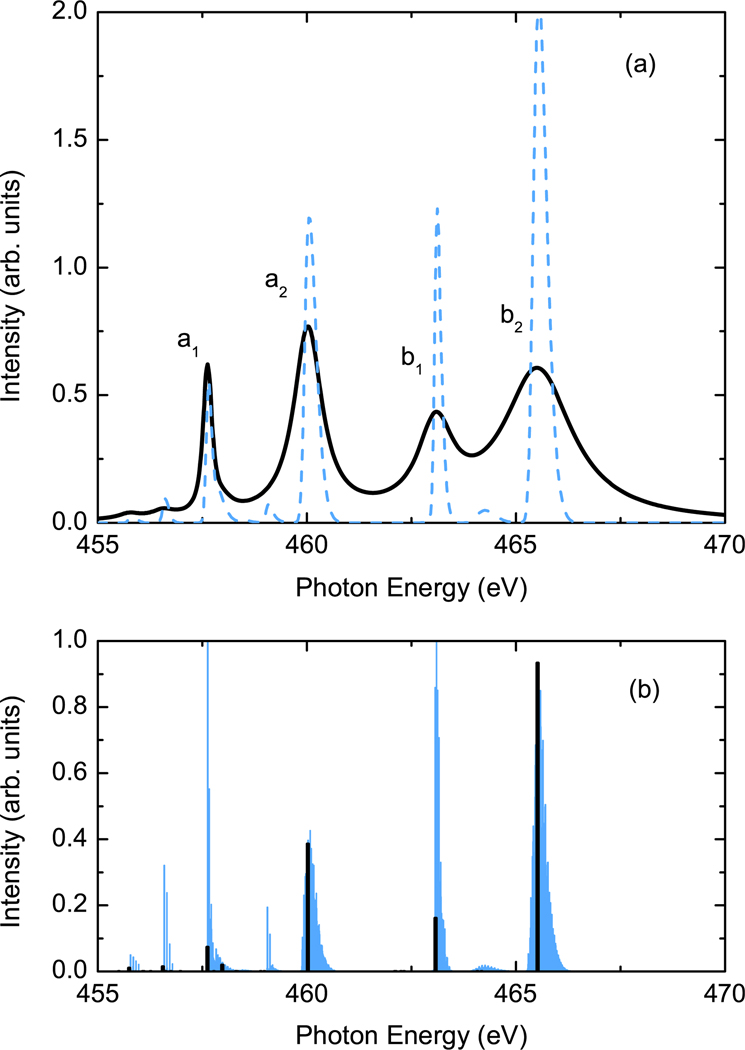
Figure 2.
Effect of vibronic coupling on the Ti L-edge absorption spectra of . (a) The solid black curve gives the absorption spectrum with all broadening effects while the blue (gray) dashed curve gives the absorption spectrum including only vibronic coupling. (b) The vibronically coupled multiplet spectrum (blue or gray lines) is compared to the unbroadened multiplet spectrum of figure 1 (black lines).

