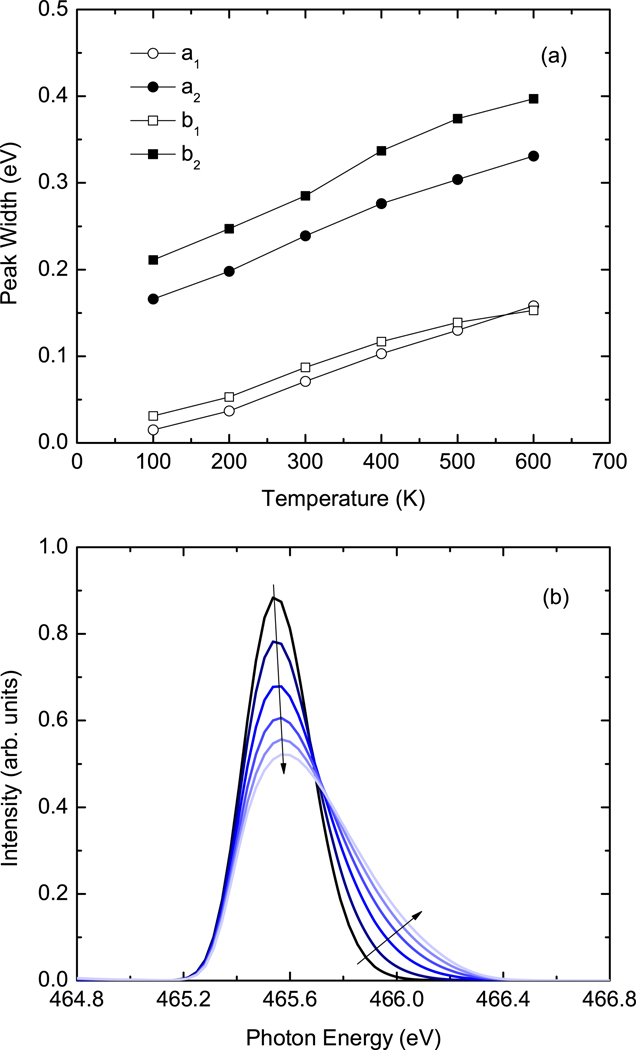
Figure 3.
Temperature dependence of the vibronic broadening. The top panel shows the full-width-half-maximum of the , , , and peaks as a function of temperature. The bottom panel presents the temperature dependence of the peak. The included curves have temperatures that increase from 100 to 600 K in increments of 100 K in the order indicated by the arrows.

