FIGURE 2.

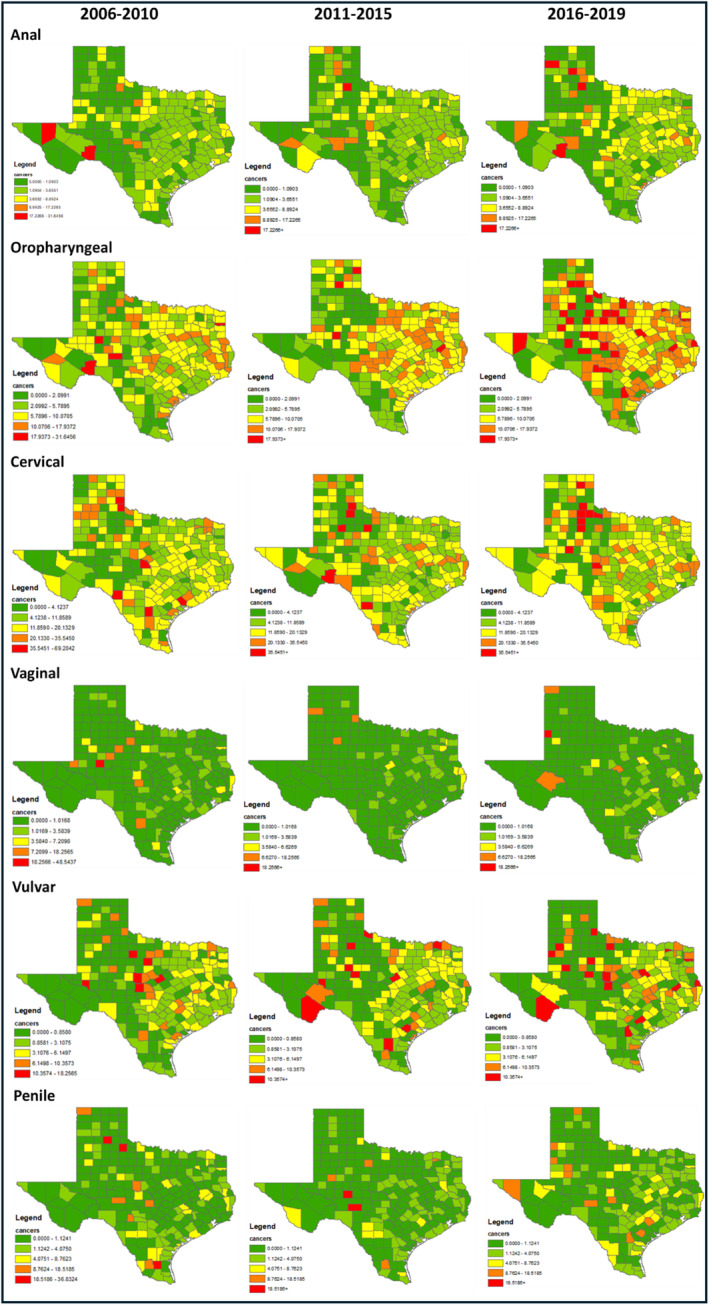
Heat map of HPV‐associated cancer incidence rates by Texas county and period, 2006–2019. Cutoff for levels (min/20th percentile/40th/80th/max) was based on the first period (2010) for each cancer and kept consistent.

Heat map of HPV‐associated cancer incidence rates by Texas county and period, 2006–2019. Cutoff for levels (min/20th percentile/40th/80th/max) was based on the first period (2010) for each cancer and kept consistent.