
Fig. 2 |. Roulette outperforms existing mutational models, under both per-gene and per-site metrics.
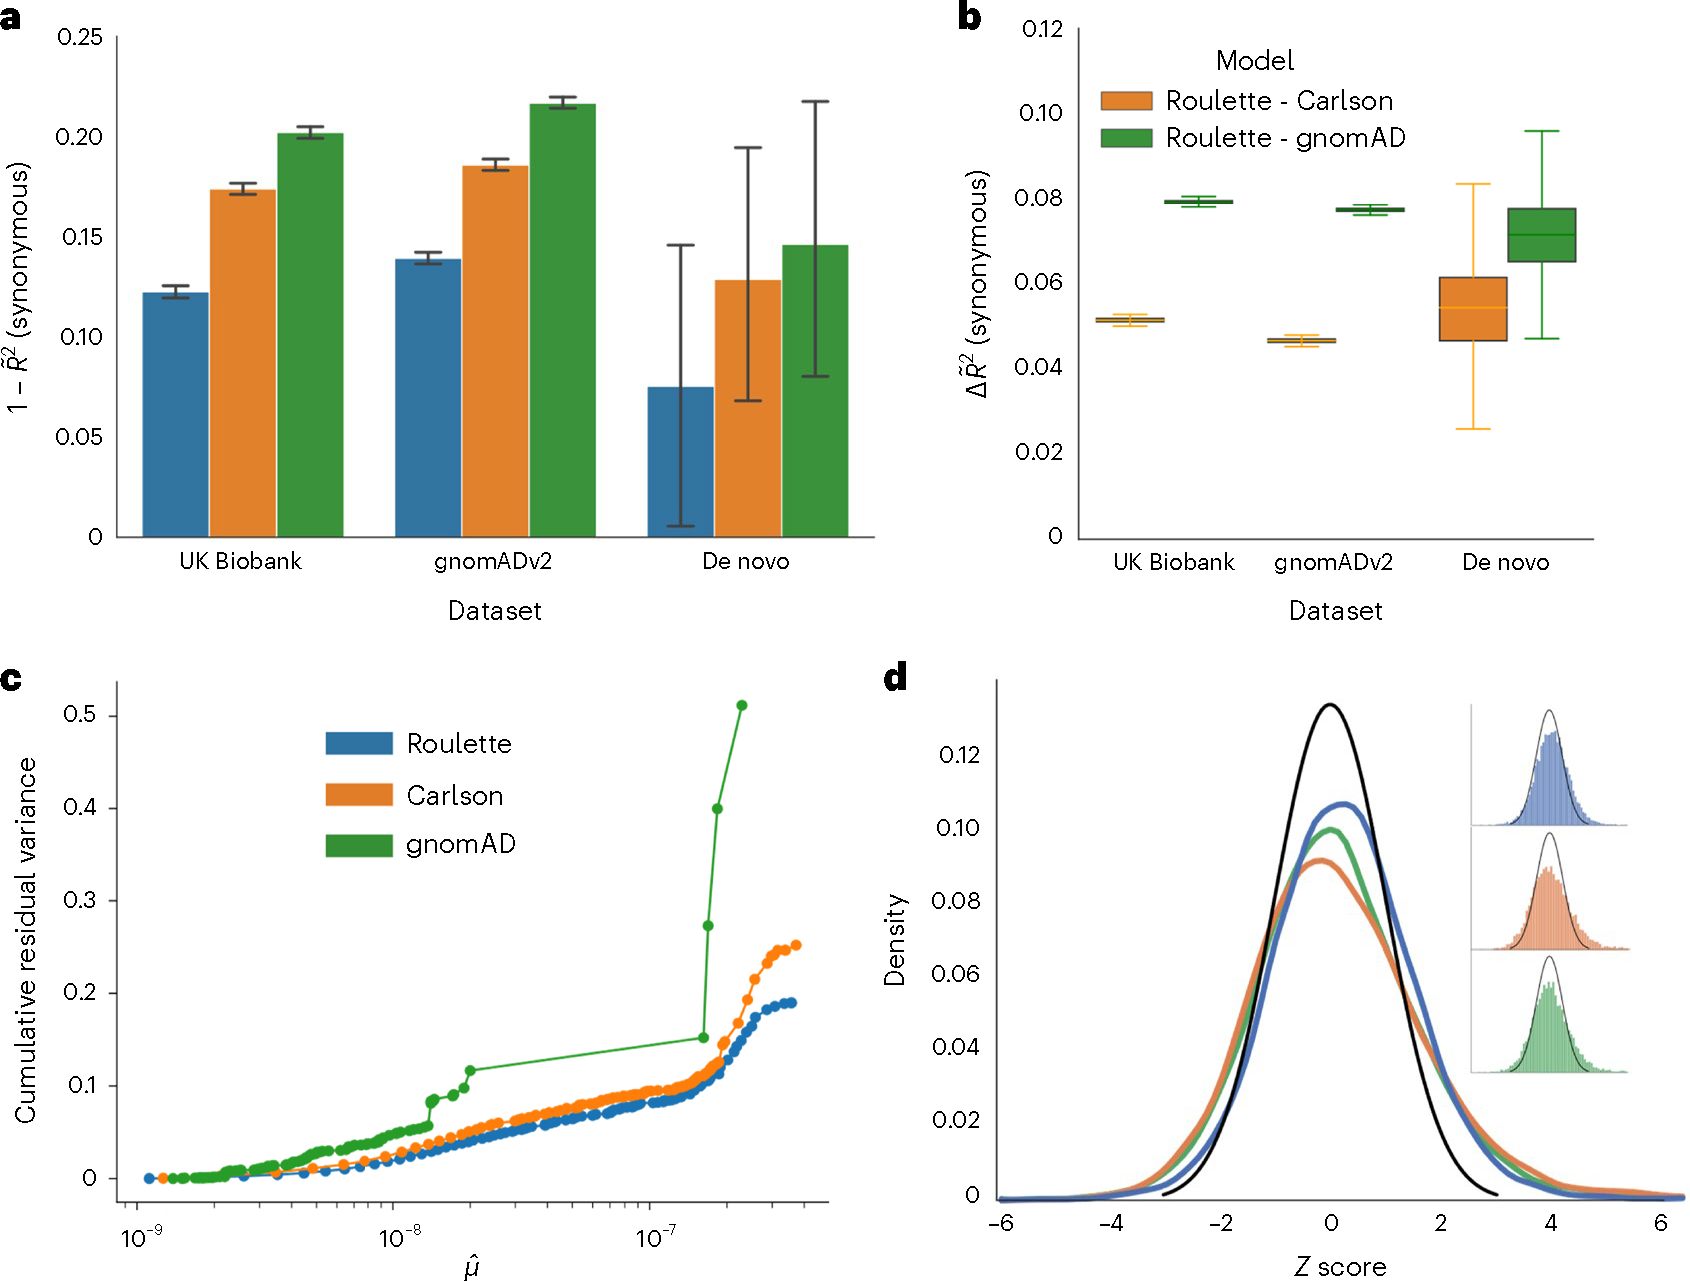
a, The 1 – pseudo-R2 values of the three mutational models on synonymous variants observed in population sequencing data (gnomAD v2.1.1 and UK Biobank) and de novo mutation datasets18,27,28. A pseudo-R2 of 0 is equivalent to using genome-wide mean mutation rate for every site. A pseudo-R2 of 1 is the best per-site mutation rate estimate we can achieve, under the constraint that the mutation rates of synonymous sites follow the predicted genome-wide distribution. Error bars represent 95% CIs estimated by bootstrap samples of synonymous sites. b, Difference in pseudo-R2 between Roulette and the two other models. The difference was calculated over each bootstrapped sample and whiskers represent estimated 95% CIs. Median is shown by a middle line, and box corresponds to 25–75% interval. c, The estimated cumulative residual variance for the Carlson, gnomAD and Roulette models after binning mutation rate estimates. Within-bin variance is scaled by the total variance estimated for Roulette. The x axis gives the estimated mean in each mutation rate bin scaled to the observed per-generation de novo rate observed in trio data. d, Error distributions on the z scale for predicted counts of synonymous mutations within genes in gnomAD v2. The standard normal density is shown in black to provide a reference for the expected error distribution if mutation rates were known without error.