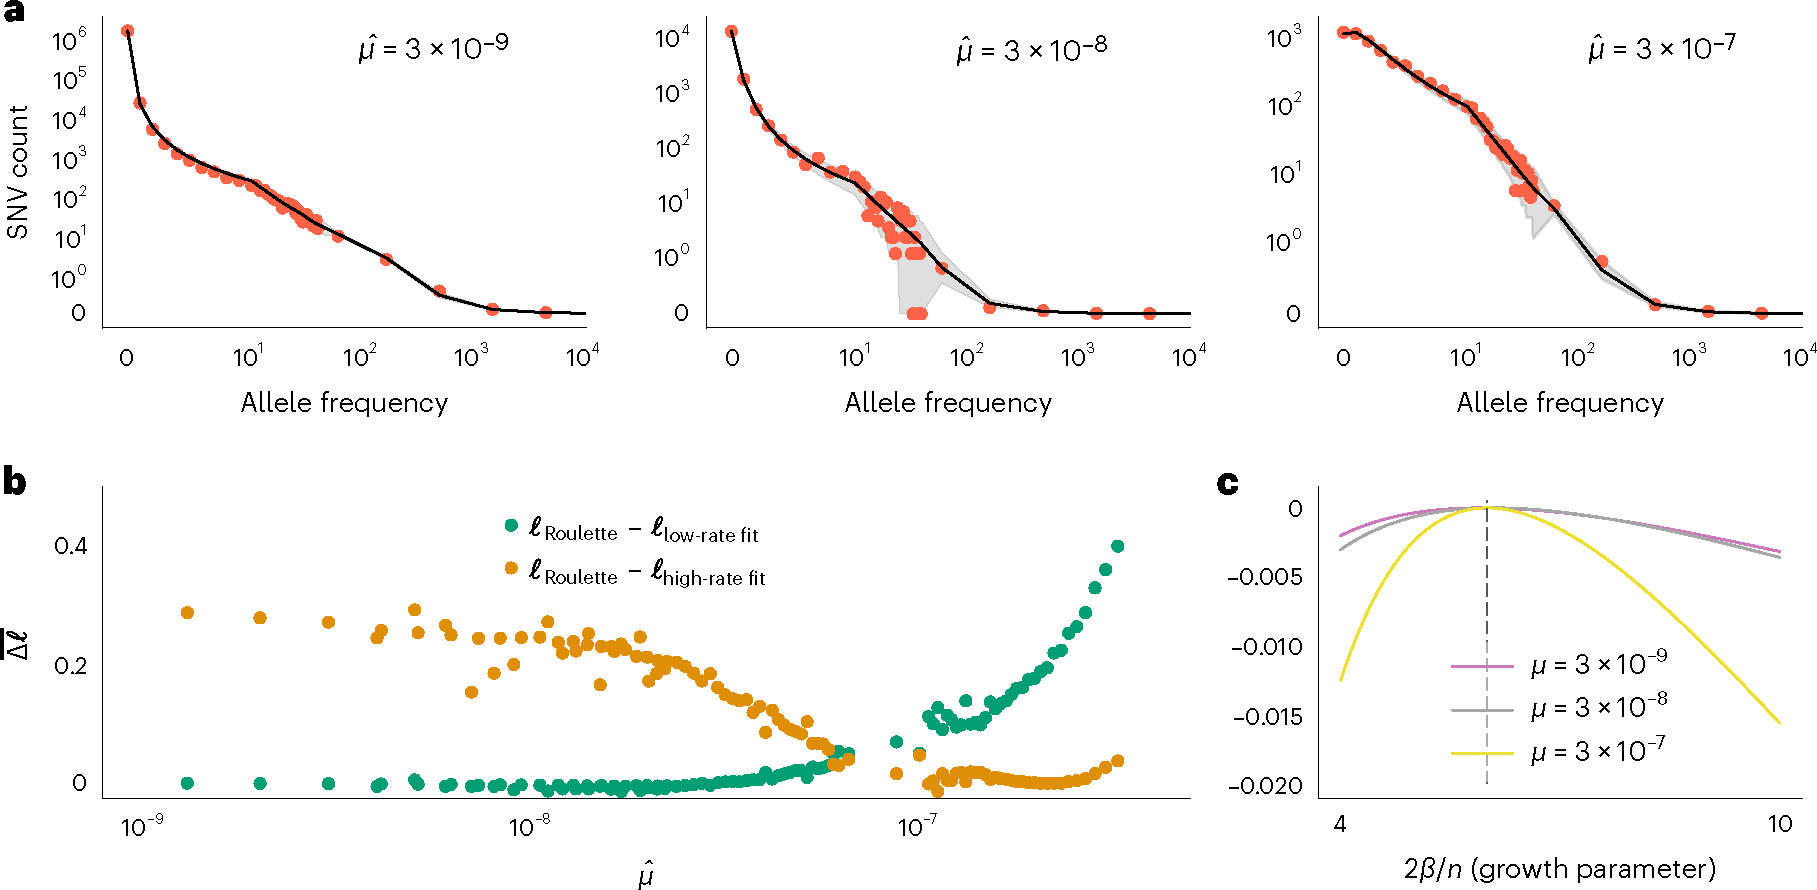
Fig. 3 |. Accurate per-site mutation rate estimates improve population genetic inference.

a, Estimated demographic history fits the SFS with mutation rate bins at different orders of magnitude. Red dots show the observed SFS at synonymous sites in gnomAD and black lines show the expected SFS under the inferred demographic model. Shaded areas correspond to 95% binomial CIs. The observed SFS (red dots) shows the observed numbers of SNVs at allele counts 0–40. For more common alleles with counts above 40, red dots show a number of SNVs for logarithmically (base 3) spaced bins. Allele counts are out of a total sample size of about 57K non-Finnish European individuals. b, Roulette bins improve fits to the shape of the SFS compared to demographic model predictions scaled to either low- (1 × 10⁻⁹ to 3.3 × 10⁻⁹) or high-rate (1 × 10⁻⁷ to 3 × 10⁻⁷) bins. Average log-likelihoods (per-SNV) are higher for Roulette after subtracting one to account for the additional parameter used to refit the mutation rate within each bin. Roulette improves over the model trained on sites with low mutation rate (mostly nonrecurrent sites) because recurrent mutations change the shape of the SFS. It also improves over the high-rate model as one moves away from the mean mutation rate within the high-rate bin. c, High mutation rate SNVs are more informative about population growth parameters. The expected per-SNV log-likelihood relative to the maximum is shown using rare SNVs (1–40 allele counts). The compound population growth rate/sample size parameter was chosen to approximate the observed synonymous SFS in gnomAD v2.
