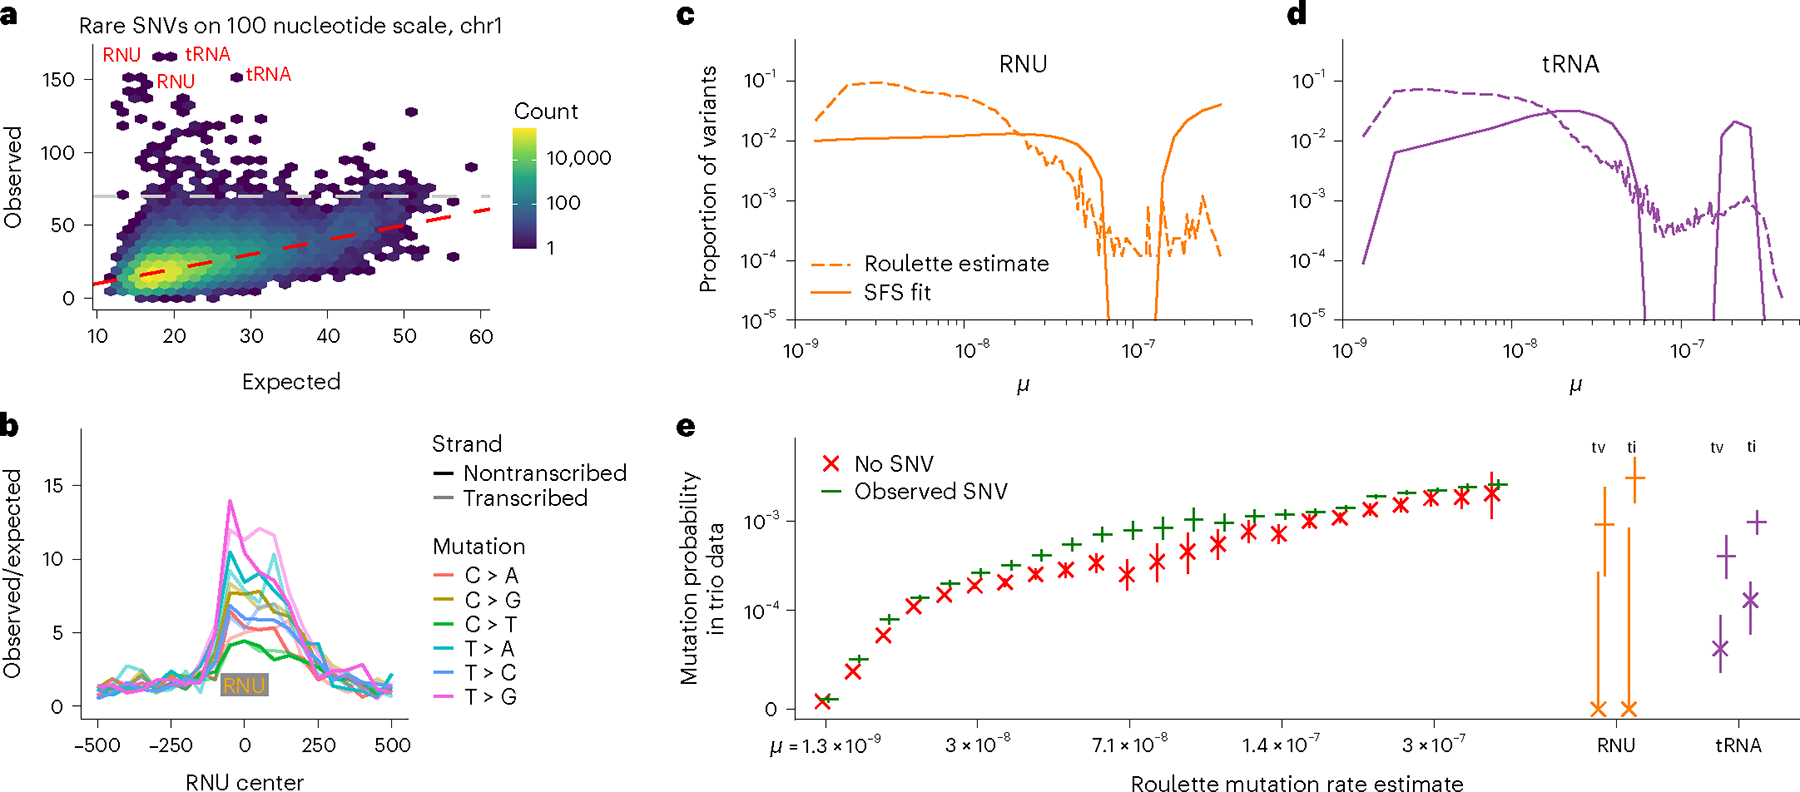
Fig. 4 |. Pol III transcripts are mutational hotspots.

a, Number of rare SNVs in 100 nucleotide nonoverlapping windows. Expectation is calculated with Roulette. While mutation counts in most regions show minor deviations from the prediction, a few loci have much higher mutation rates (>70 SNVs, above the gray line). These loci are heavily enriched with Pol III transcripts. b, Mutation rate at and around small nuclear RNAs (RNU); the median RNU size is depicted as a gray rectangle. c,d, The proportion of variants with different mutation rates estimated by Roulette for observed SNVs in (c) RNU and (d) tRNA genes. These are compared to estimates of the distribution of SNV mutation rates obtained by fitting SFS in these genes obtained using a mixture model. The SFS in each of 21 mutation rate bins was estimated from all variants on chromosome 21 (gnomAD v3) and the mixtures of these bins that best fit the observed SFS in each gene class were fit using likelihood and a smoothing penalty. e, SFS-based mutation rate predictions suggest that RNU and tRNA genes contain a subset of high mutation rate sites not predicted by Roulette. Mutations in these genes were separated by ti/tv and whether that SNV was observed in gnomAD v3, and the probability of observing that mutation in the de novo mutation data is shown on the y axis. These probabilities are compared to similar estimates made genome-wide for a subset of mutation rate bins.
