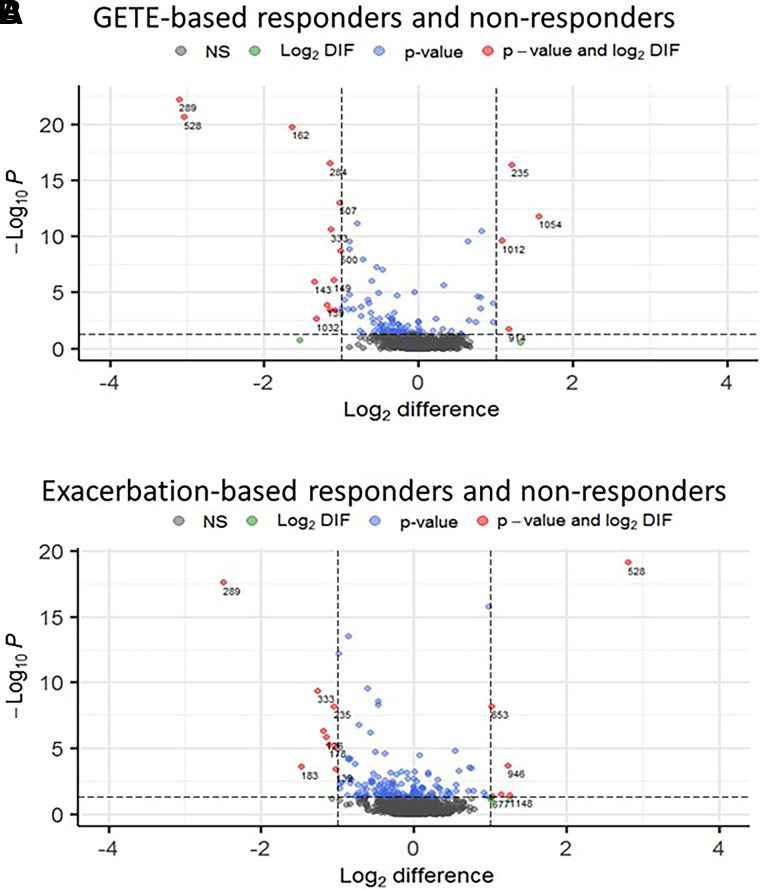
Figure 3.
Volcano plots of baseline concentrations of all biomarker variables in responders and nonresponders. Responses shown include early response judged by GETE response (A) and late response defined by ⩾50% reduction in exacerbations (B). The red and blue biomarkers (all P < 0.05) are labeled by numbers (see Table E4 for identities). Green and red dots represent greater than onefold different biomarkers. The data are shown as the means of concentrations in the responders from which the means of the concentrations in the nonresponders have been subtracted (i.e., responder minus nonresponder). They are shown as log2-transformed data. The P values were obtained by Mann-Whitney U test. GETE = Global Evaluation of Therapeutic Effectiveness.

