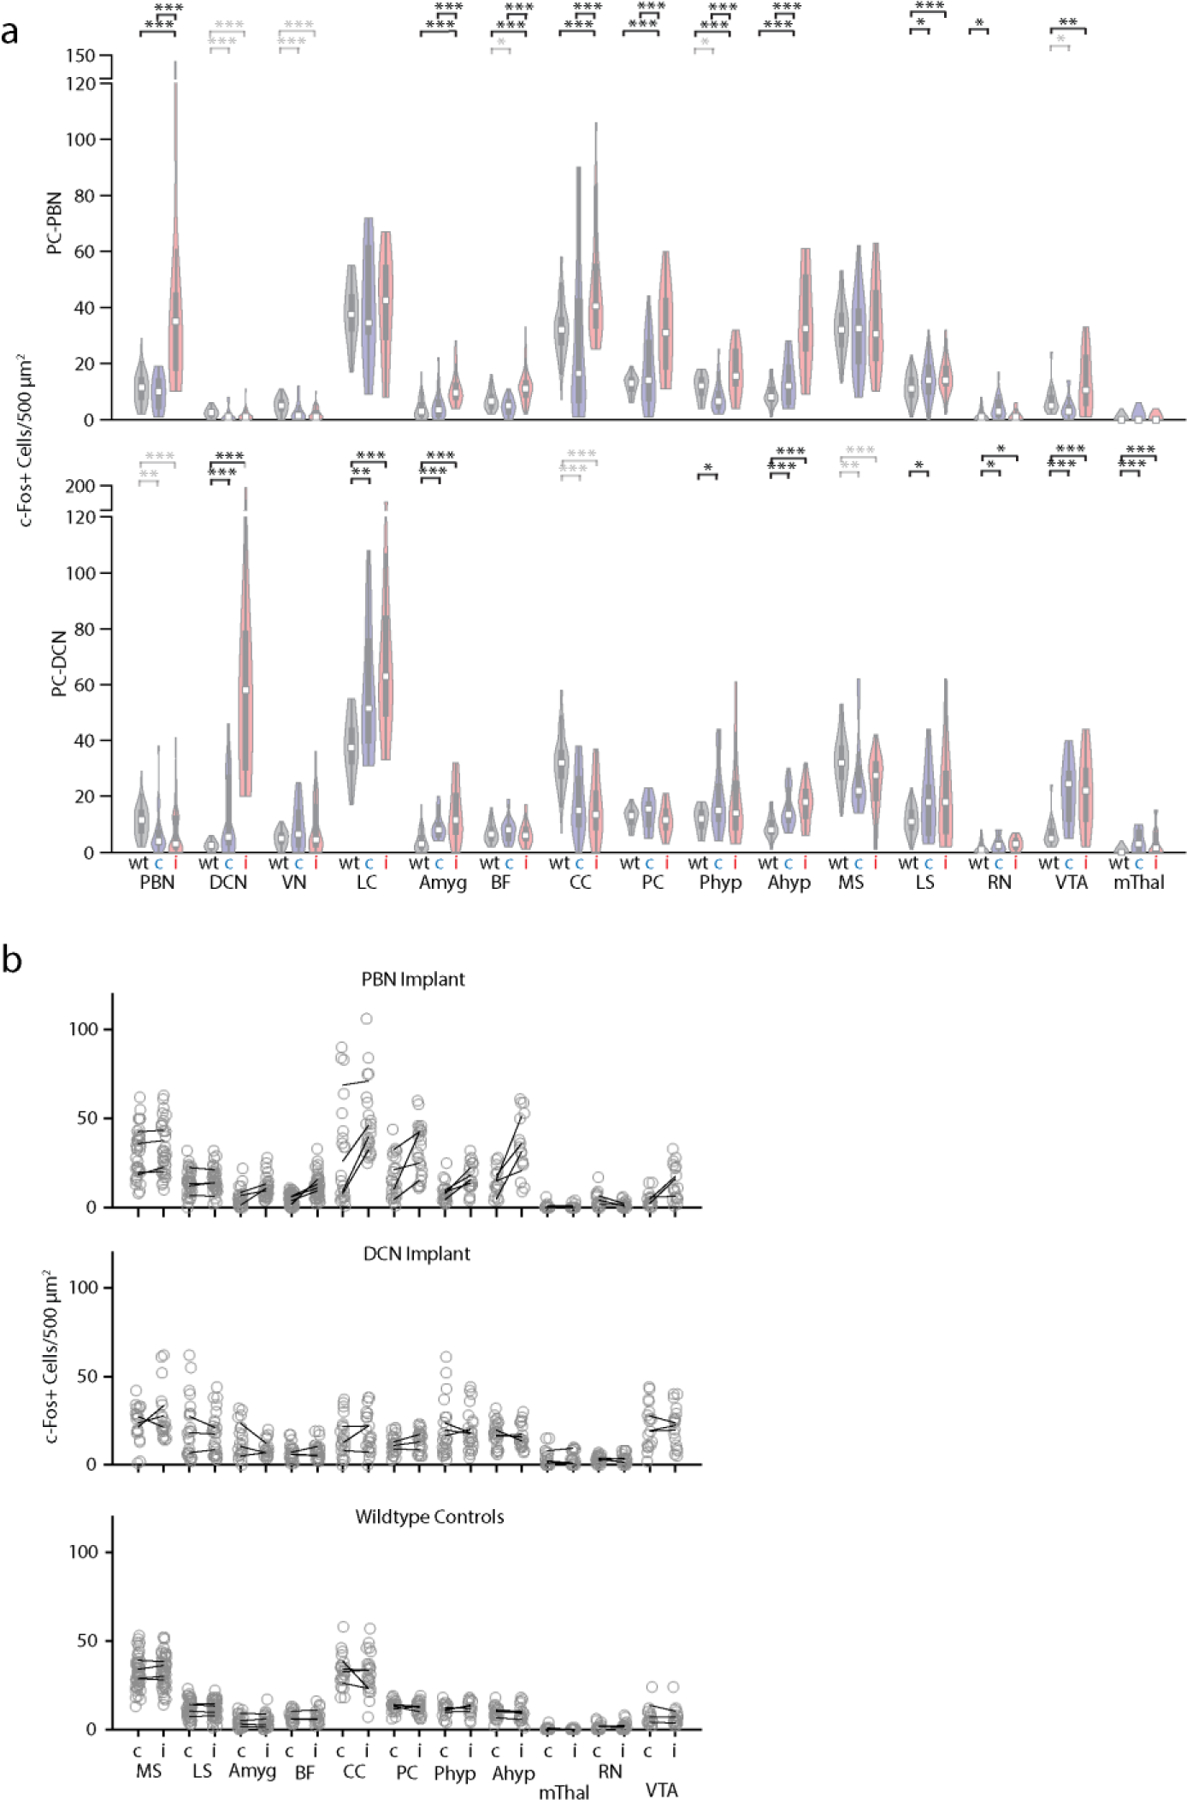
Extended Data Fig. 9: Upregulation of c-Fos following unilateral suppression of the PC-PBN or PC-DCN pathway.

a. Distributions of c-Fos positive cells following inhibition of PC-PBN or PC-DCN pathways. Data corresponds to that shown in Fig. 3a-f and Fig. 4h-m. For wildtype mice hemispheres were combined because there was no apparent difference between hemispheres (see B). * p<0.05, ** p<0.01, ***p<0.001. Grey indicates a decrease in the highlighted comparison. “c” and “i” correspond to contralateral and ipsilateral.
b. Corresponding regions and c-Fos densities for PC-PBN stimulated (top), PC-DCN stimulated (middle), and wildtype (bottom) animals. The average number of c-Fos+ cells in different regions are plotted for each mouse (black lines). Cell counts are plotted for individual slices (grey symbols). See Table 1.
c.
