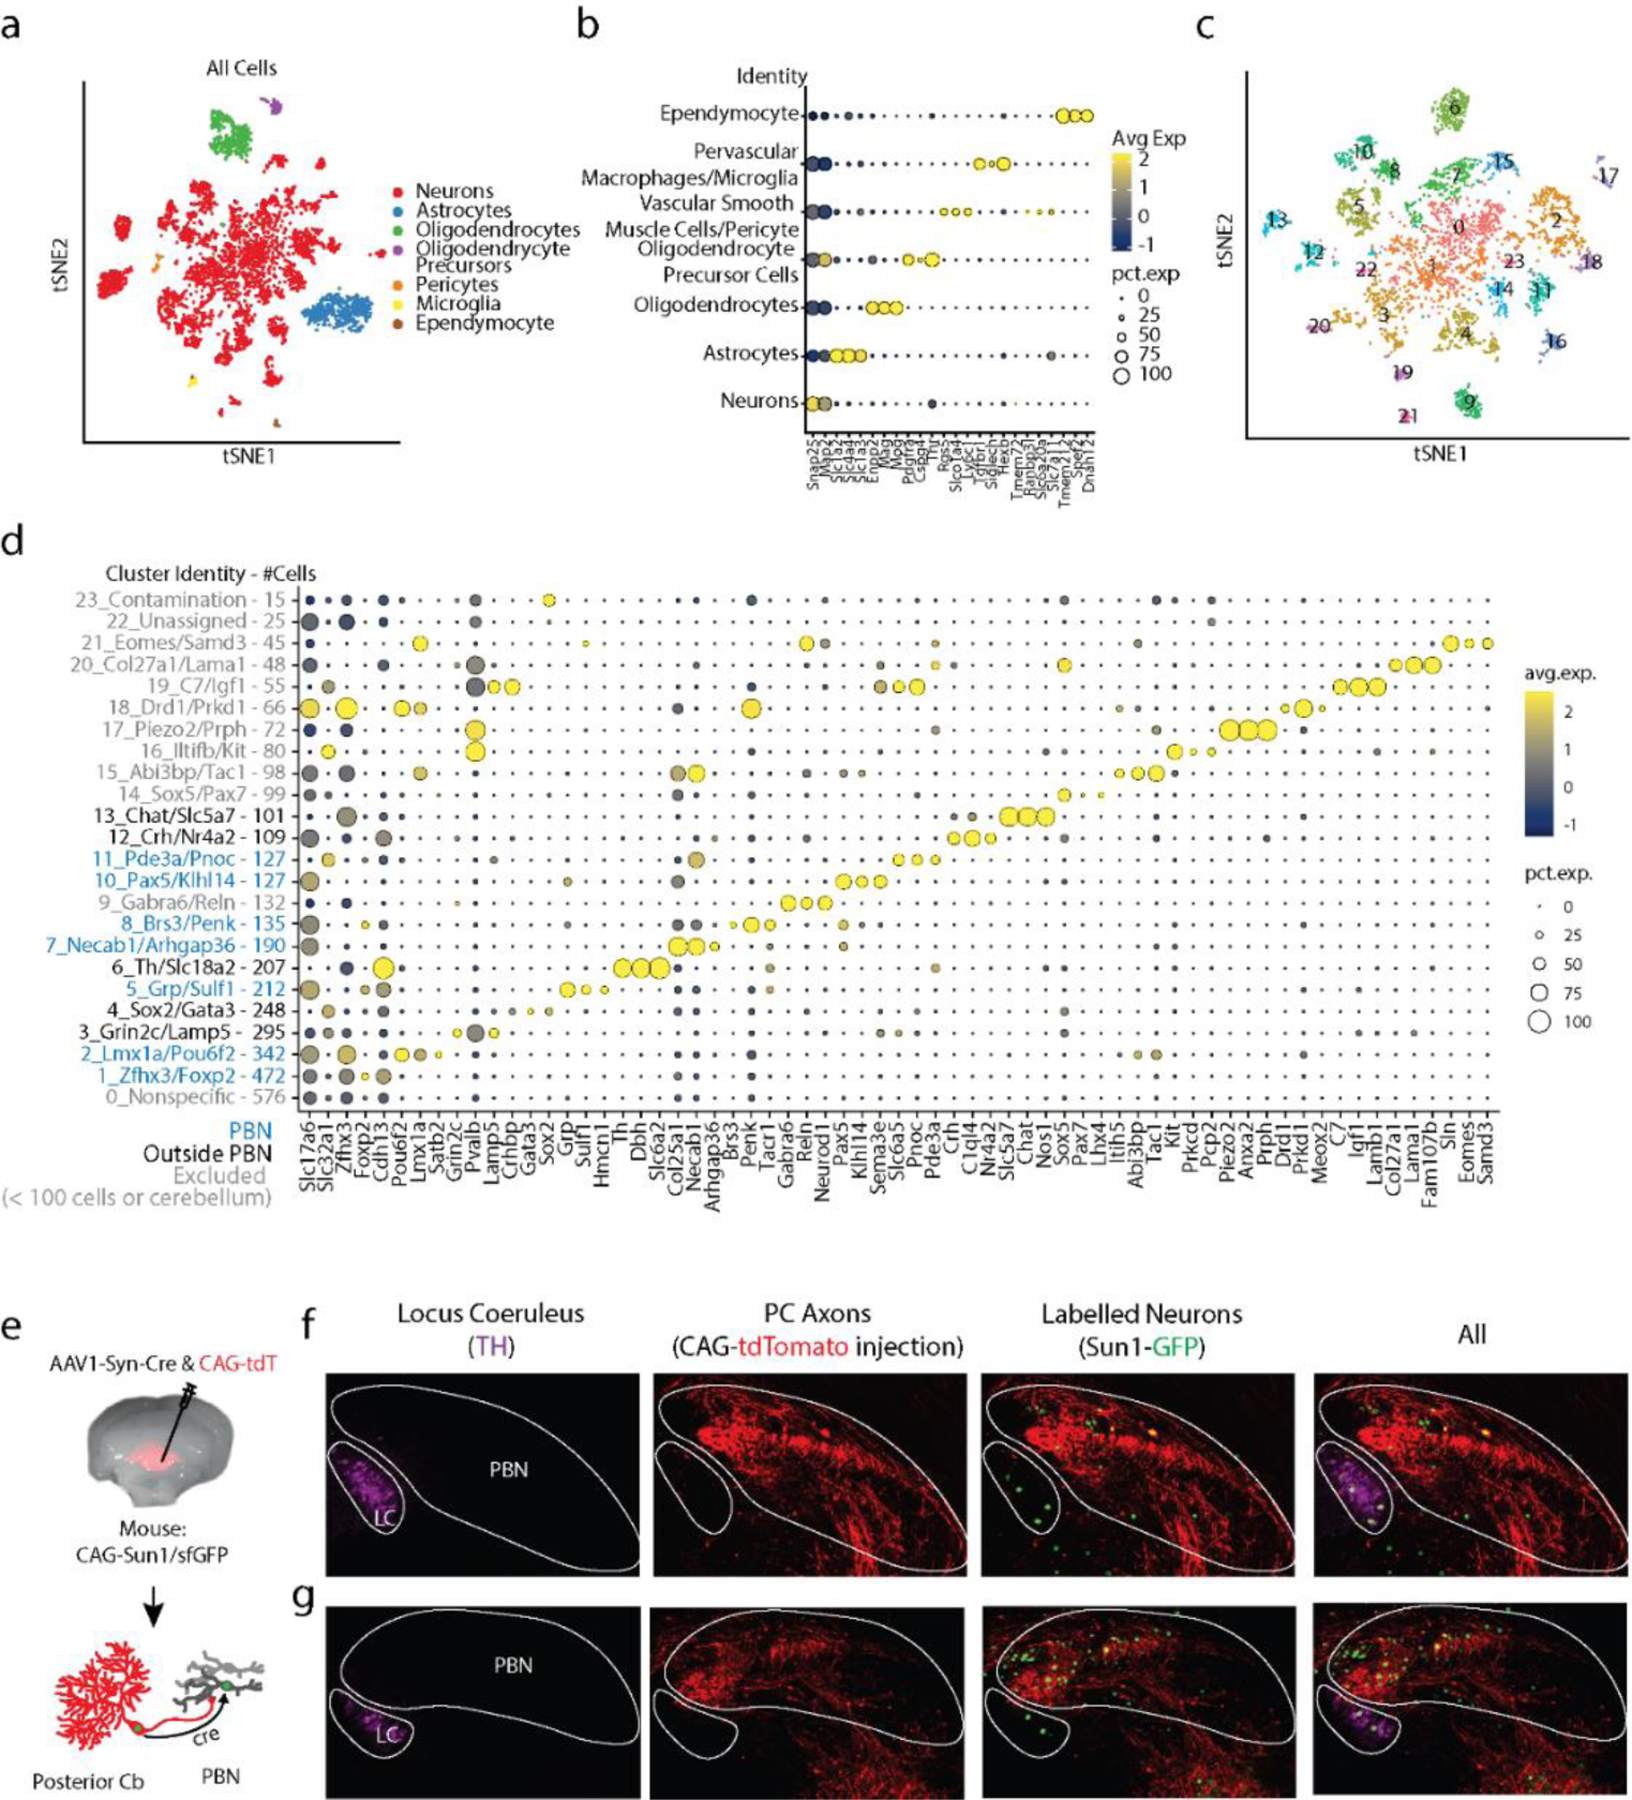
Extended Data Fig. 10: RNAseq of brainstem neurons labelled following injections of AAV1-Syn-Cre into the posterior cerebellum of CAG-Sun1/sfGFP mice.

a. tSNE visualization of all cells following fluorescence activated nuclei sorting. Clusters were sorted into cell types based off of expression of markers indicated in b.
b. Dot plot of scaled expression for indicated clusters
c. tSNE visualization of just neurons from a. Cluster numbers correspond with those in d.
d. Dot plot of scaled expression for indicated clusters ordered from largest to smallest, with number of cells in each cluster indicated in the axis label. Shown are 3 of the most significantly expressed genes for each cluster, along with Slc17a6 (glutamatergic neurons) and Slc32a1 (GABAergic neurons). Clusters with < 100 cells were categorically excluded. Cluster 9 contains Gabra6, a known marker for cerebellar granule cells, thus likely reflects cerebellar contamination, and was excluded from subsequent analysis.
e. AAV1-Syn-Cre and AAV1-CAG-tdTomato were coinjected into the posterior vermis of a CAG-Sun1/sfGFP mouse. Slices of the PBN region were made to visualize trans-synaptically labelled neurons with GFP, PC axons with tdTomato, and the locus coeruleus by staining for tyrosine hydroxylase (TH). Two sections shown in f, g. Labelled cells in the LC were far from PC axons, as opposed to labelled PBN neurons, which were close to PC axons. This indicates that most of the labelling of LC neurons is due to retrograde rather than anterograde labelling.
