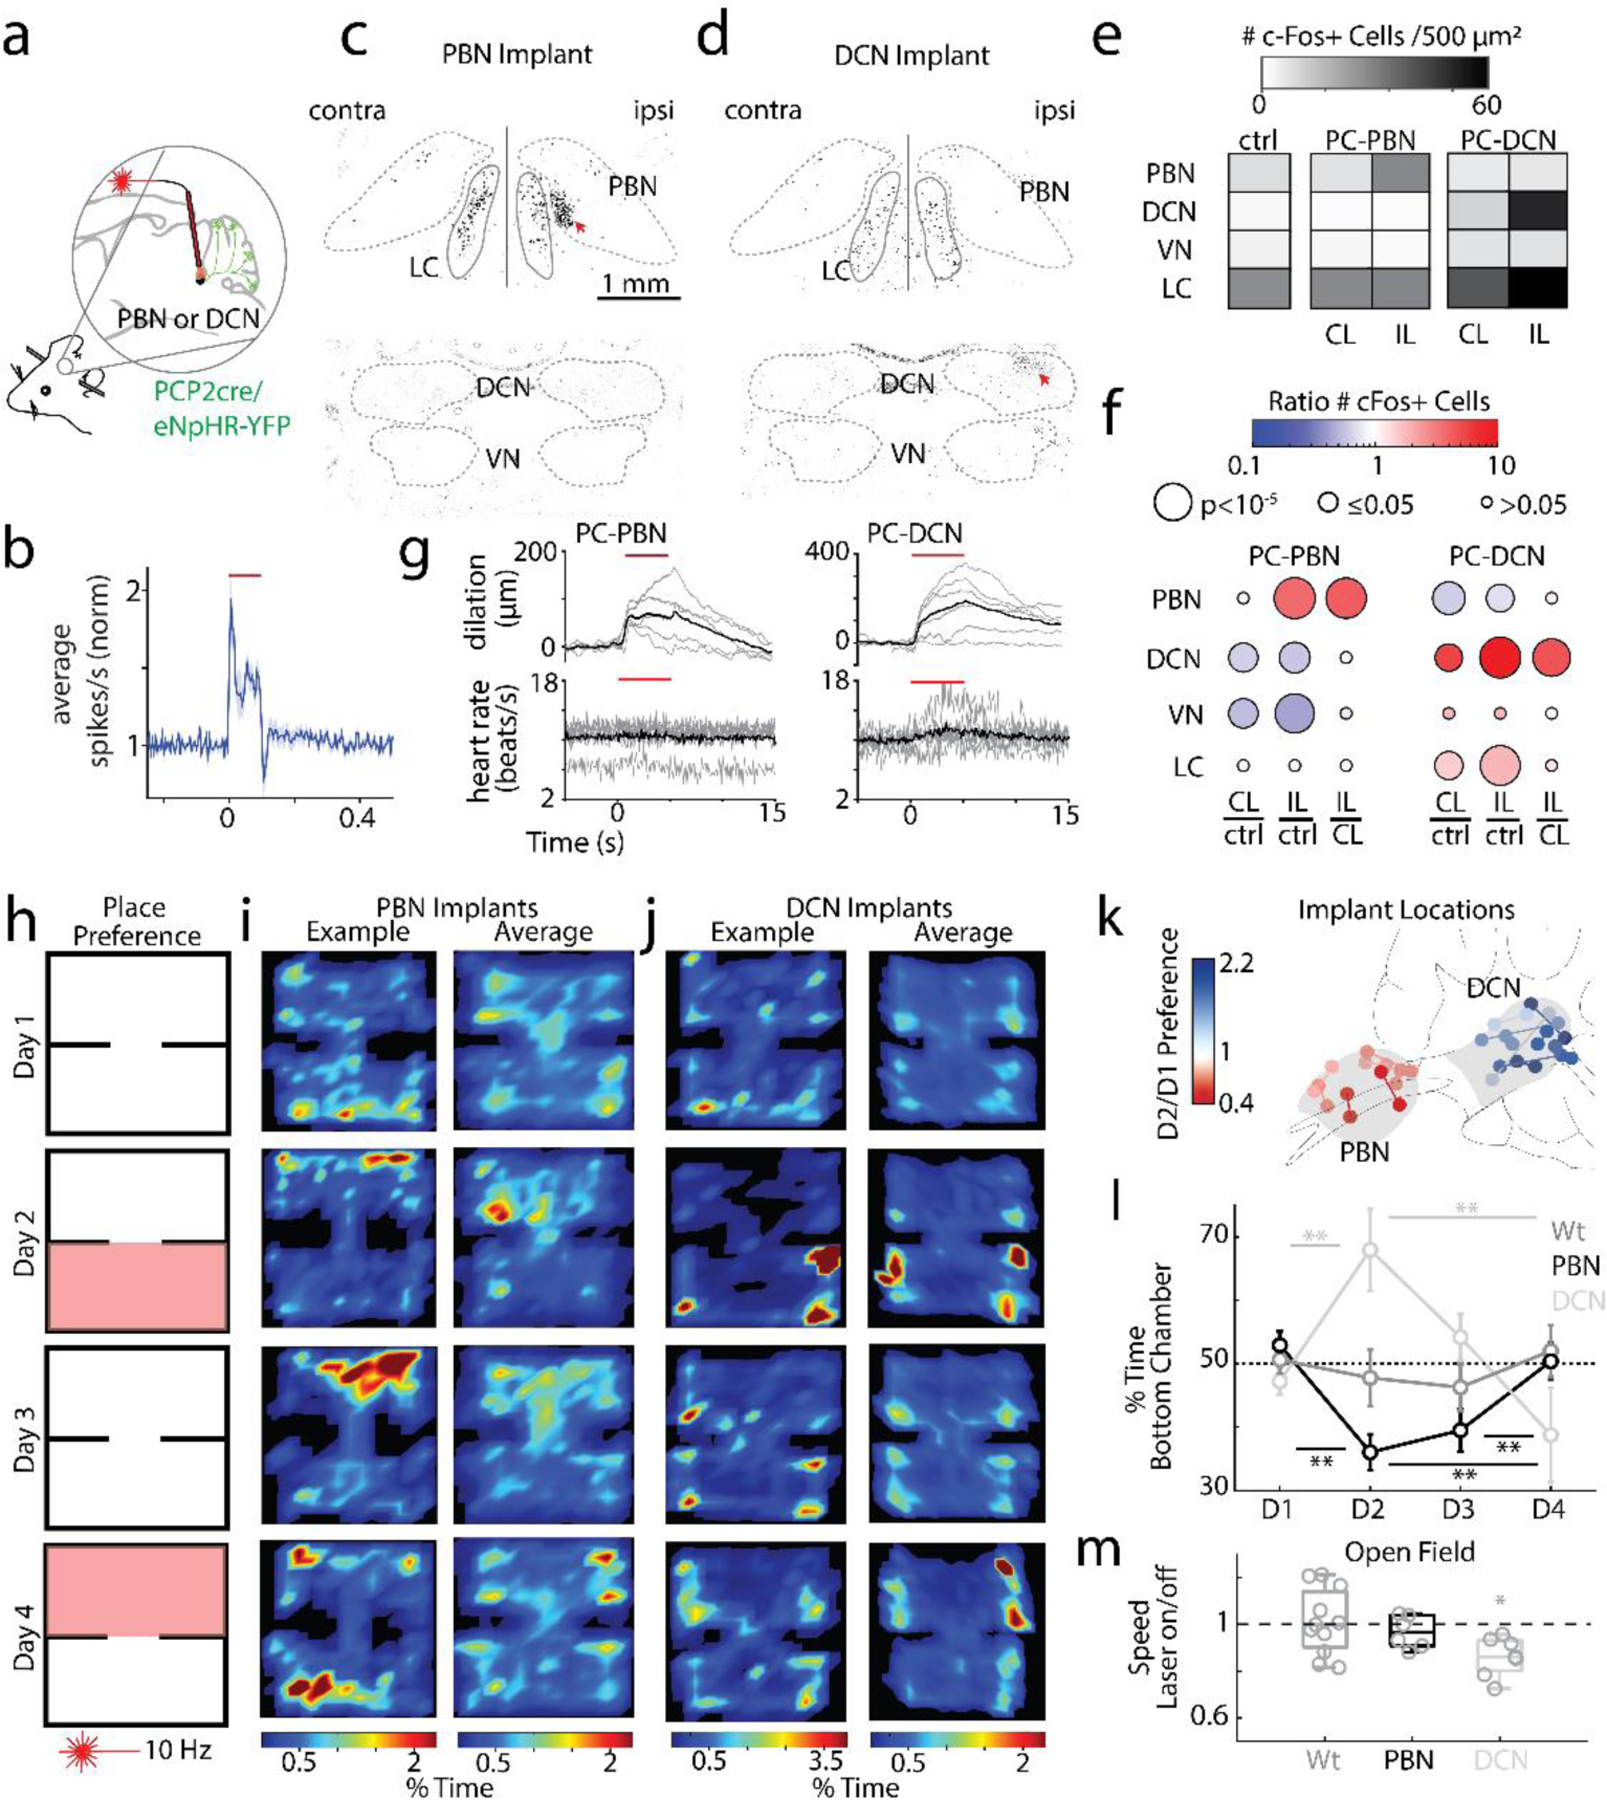
Fig. 3:

Suppression of the PC-PBN pathway is aversive.
a. Schematic of Halo/PCP2cre mice with bilaterally implanted optical fibers in either the PBN or DCN.
b. Average single-unit PBN response to the inhibition of the PC-PBN pathway (red line) (n=17). Shaded area indicates standard error.
c-d. Suppressing PC-PBN or PC-DCN pathways locally elevated c-Fos expression (red arrows).
e. Summary of number of c-Fos expressing cells in different regions after PC-PBN, PC-DCN, or control (wildtype) stimulation. CL: contralateral to stimulation; IL: ipsilateral.
f. Comparisons of c-Fos expression shown in e. Cool colors indicate a decrease in expression and hot colors an increase. White indicates no relative change. Statistical significance for each comparison is indicated by symbol size (Table 1).
g. The effects of suppressing either the PC-PBN or PC-DCN pathways on pupil dilation and heart rate (Table 2).
h. Experimental configuration is shown for a two-chamber place preference test. Regions in which PC inputs to either the DCN or the PBN were optically stimulated are indicated in red.
i. Example (left) and average (right, n=7) position heat maps for corresponding test days for PC-PBN suppression.
j. Same as i, but for PC-DCN suppression (n=9).
k. Bilateral implant locations indicated in a sagittal slice of the brain (left is anterior). Chamber preference for each animal (Test/Baseline; D2/D1) is encoded by the color of the corresponding implant location pairs.
l. Summary of the % time spent in the bottom chamber for PC-PBN suppression (red) and DCN suppression (blue), and control mice (grey) (mean ± S.E.M, Table 3).
m. Change in velocity after stimulation in open field test (see Extended Data Fig. 5, Table 4).
