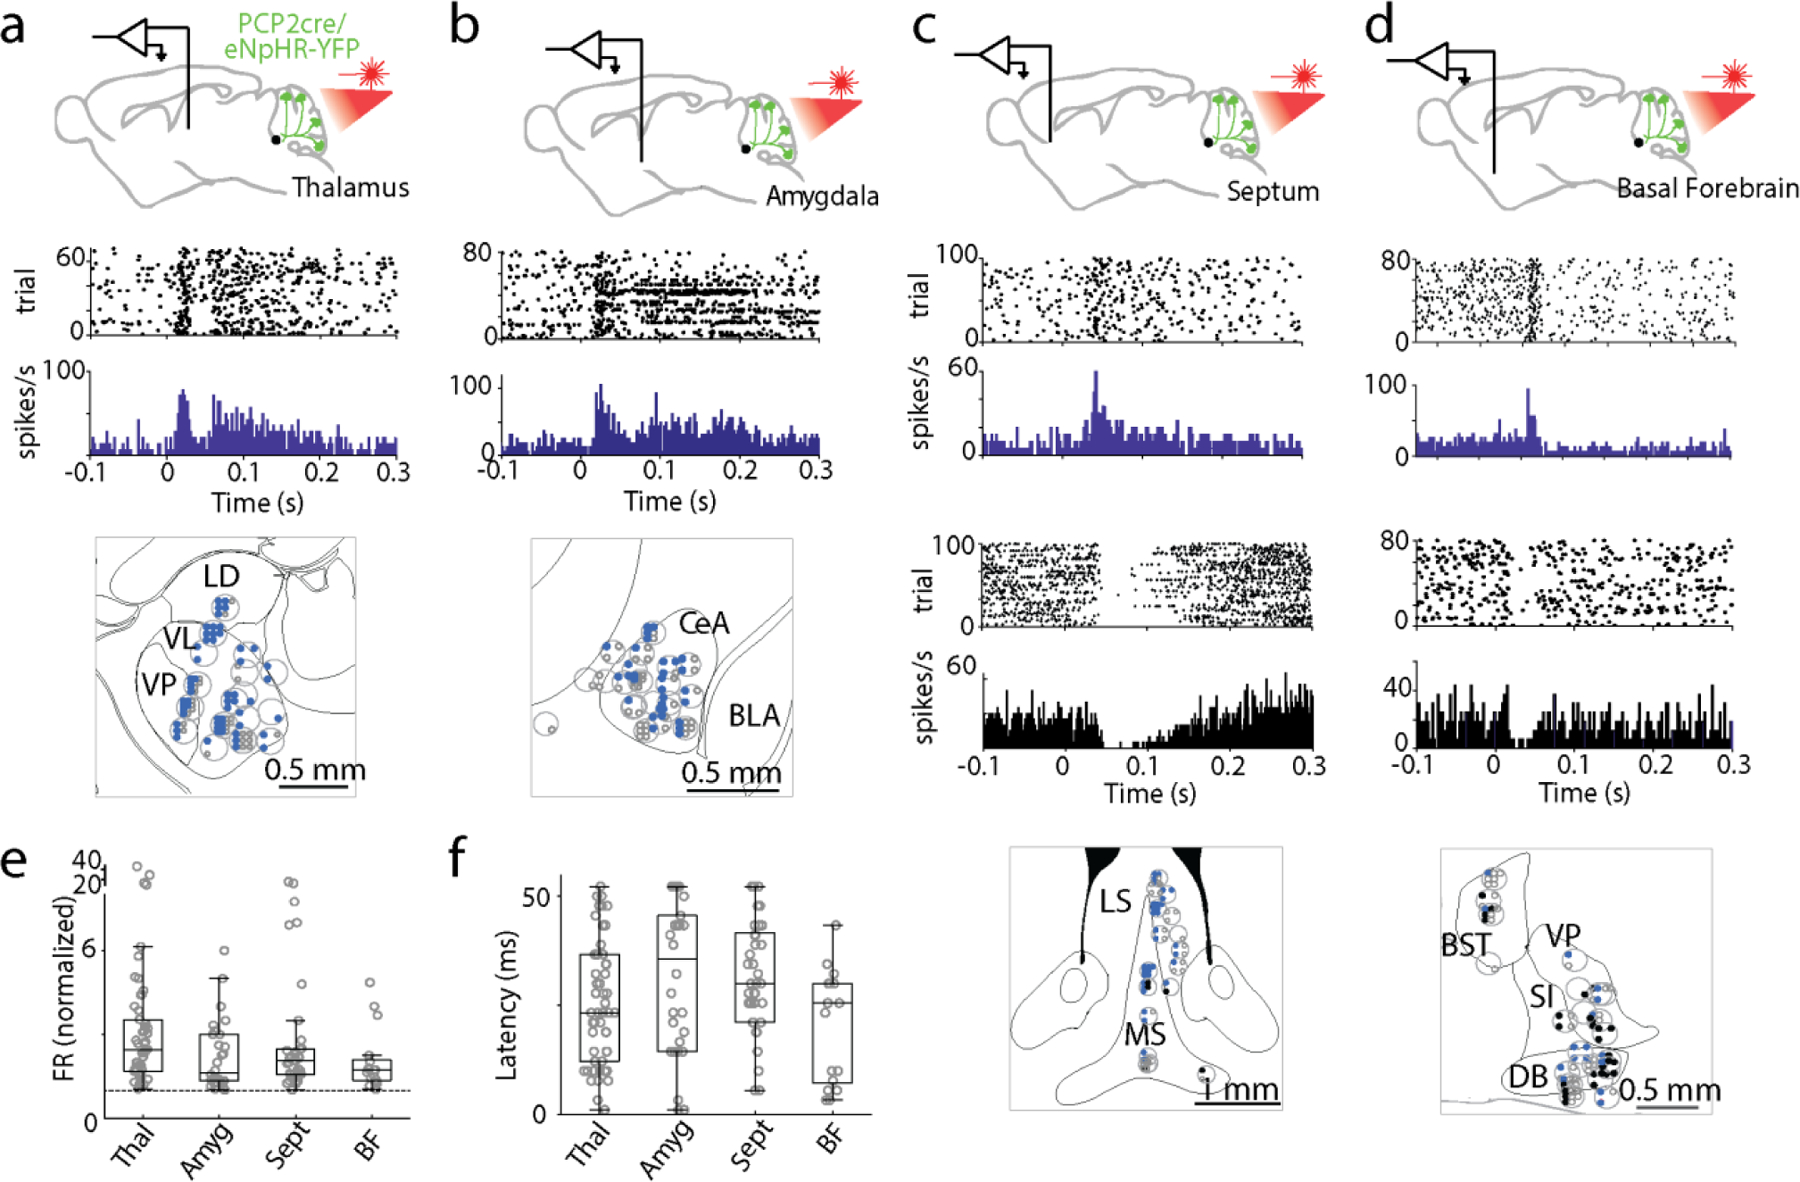
Extended Data Fig. 1: Suppressing PC firing evoked short latency responses in multiple brain regions.

Single-unit, multielectrode array recordings were made from awake, head-restrained PCP2Cre/Halo mice across several areas in the brain. Example single cell responses are shown for the thalamus (a), amygdala (b), septum (c), and basal forebrain (d). Pauses in activity after stimulation were observed in the septum and basal forebrain in a fraction of recorded cells. Example pauses are shown in black. Recording sites are indicated in the grey circles within the corresponding panels on the lower panels. Blue dots indicate responding cells at each site, black dots indicated cells with pauses in firing after stimulation, and open circles indicate nonresponding cells. e, f. Box plots representing normalized change in firing rate (e) and average latency (f) for each region. LD: laterodorsal, VL: ventrolateral, VP: ventral posterior, CeA: central amygdala, BLA: basolateral amygdala, LS: lateral septum, MS: medial septum, BST: bed nucleus of the stria terminalis, VP: ventral pallidum, SI: substantia innominate, and DB: diagonal band of broca.
