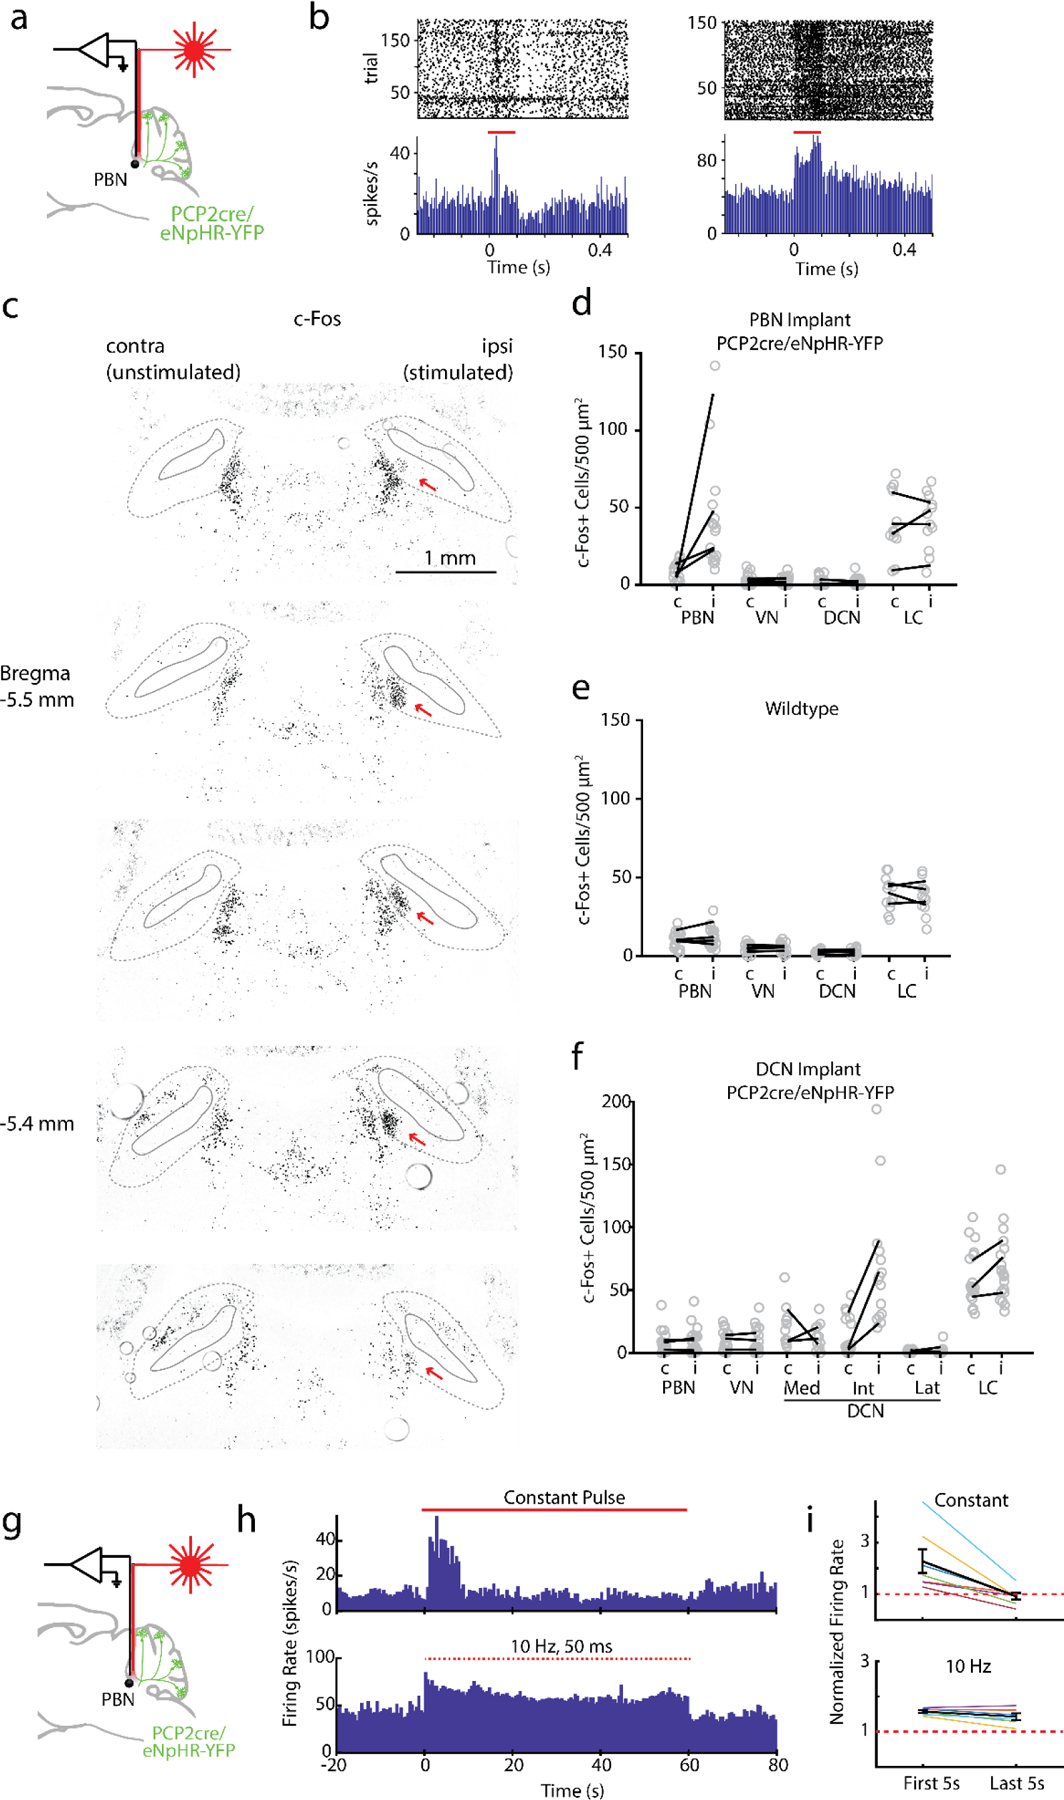
Extended Data Fig. 4: Specificity and strategy for suppression of the PC-PBN or PC-DCN pathway.

Awake, head-restrained single-unit recordings in the PBN were made using an optrode in a Halo/PCP-Cre mouse.
B. Two example cells showing increases in firing evoked by 100 ms light pulses (red lines).
C. Images for an example c-Fos stimulation experiment shown in Fig. 3c. PC inputs to the PBN were suppressed by activating halorhodopsin. In this experiment, unilateral c-Fos upregulation was observed in medial side of the PBN near the tip of the optical fiber(red arrow). Brachium is indicated in the solid grey lines, and bounds of the PBN in dotted lines.
D. -f. Hindbrain c-Fos densities for PC-PBN suppression (d), wildtype (e), and PC-DCN stimulated (f) animals. Average numbers of c-Fos+ cells per mouse plotted in black lines for the stimulated (i, ipsilateral) and unstimulated (c, contralateral) sides. Individual areas plotted in grey circles.
g. Recordings were made from PBN neurons with an optrode. Light was delivered to the immediate region with the attached optical fiber.
h. (top) Example single cell response to continuous light delivered to PC-PBN axons. (bottom) Example response of another cell to pulsed (10 Hz, 50 ms pulses) light delivered to PC-PBN axons.
i. Summary data showing the firing rate in the first and last 5 s of the train for continuous (top) or pulsed (bottom) trains. We used 10 Hz, 50 ms pulses to suppress the PC-PBN in behavioral experiments due to the superior stability of PBN neuron firing.
