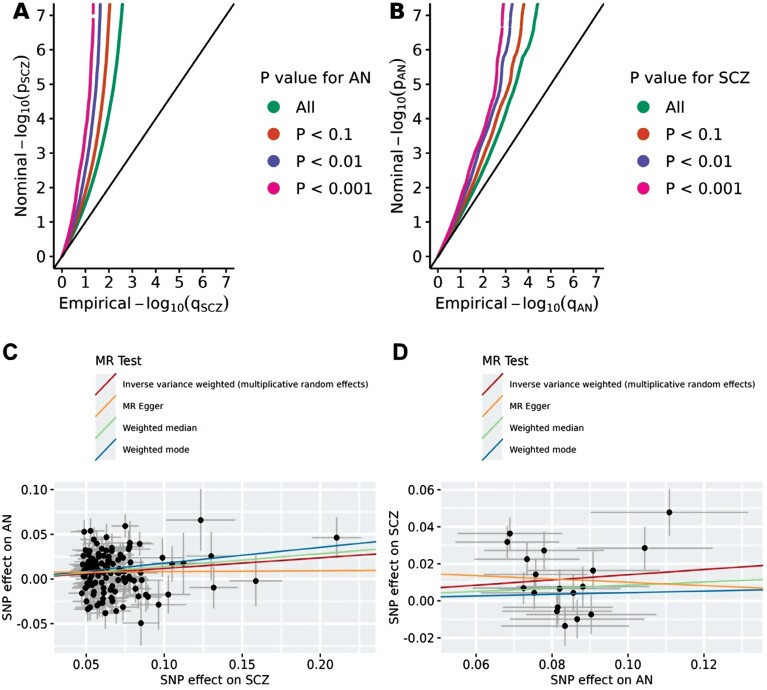
Fig. 1.
Conditional quantile-quantile (Q-Q) plots and Mendelian randomization scatter plots for the associations between schizophrenia (SCZ) and anorexia nervosa (AN). The conditional quantile-quantile plot of nominal vs empirical −log10 p values for SCZ as a function of significant association with AN at P value <.1, P value <.01, and P value <.001 (A), and vice versa (B). The black diagonal line indicates the global null hypothesis. Scatter plots for effects of SCZ and AN for instrumental variants of SCZ (panel C, n = 127), and AN (panel D, n = 18). Lines represent the regression of SNP effects for exposure (SCZ for A and AN for B) on the SNP effects for outcome (AN for A and SCZ for B), corresponding to a meta-analysis using random-effects inverse variance weighted, MR-Egger regression, weighted-mode, and weighted-median methods. Note: MR, Mendelian randomization.

