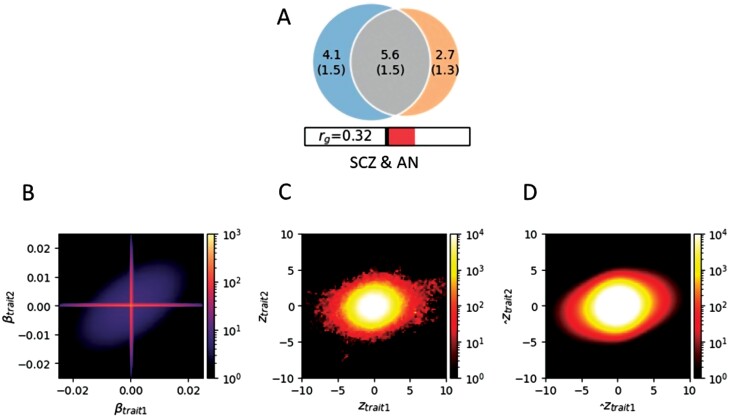
Fig. 2.
Polygenic overlap between schizophrenia (SCZ) and anorexia nervosa (AN). (A) The Venn diagram illustrates the estimated number of non-null variants shared between SCZ and AN, and specific to each disorder: numbers in the circle indicate the quantity (standard error) of genetic variants in thousands. The circle on the left represents SCZ, the circle on the right represents AN, and the center part represents overlap. The size of the circle indicates polygenicity, with a larger circle reflecting greater polygenicity. The estimated genetic correlation is also shown below the Venn diagram, with an accompanying directional scale (shading to the right indicates positive correlation). (B) The density plot for additive causal effects that underlie model prediction. (C) The density plot for observed GWAS signed test statistics. (D) The corresponding density plot predicted from the fitted MiXeR model. Trait1 = SCZ; Trait2 = AN. Note: GWAS, genome-wide association study.

