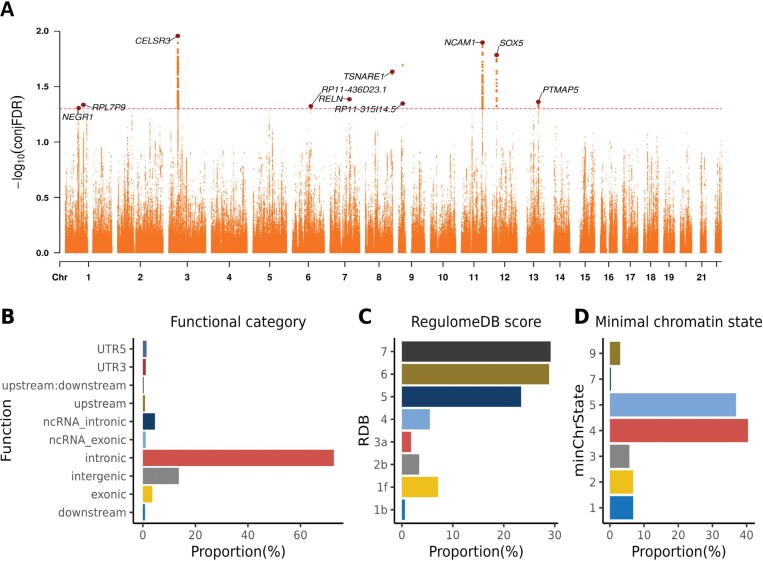
Fig. 3.
Common genomic loci jointly associated with schizophrenia and anorexia nervosa at conjunctional false discovery rate (conjFDR) <0.05. (A) A Manhattan plot with −log10-transformed conjFDR values for each SNP on the y-axis and chromosomal positions along the x-axis. The dashed horizontal line represents the threshold for significant shared associations. Independent lead SNPs are marked by large dots. The gene nearest to each shared locus is annotated. (B) The distribution of functional consequences with SNPs annotated using ANNOVAR. (C) The distribution of likely regulatory functions annotated using RegulomeDB. (D) The distribution of the minimum chromatin states, annotated based on 15 categorical states, with lower states indicating higher accessibility to regulatory elements.

