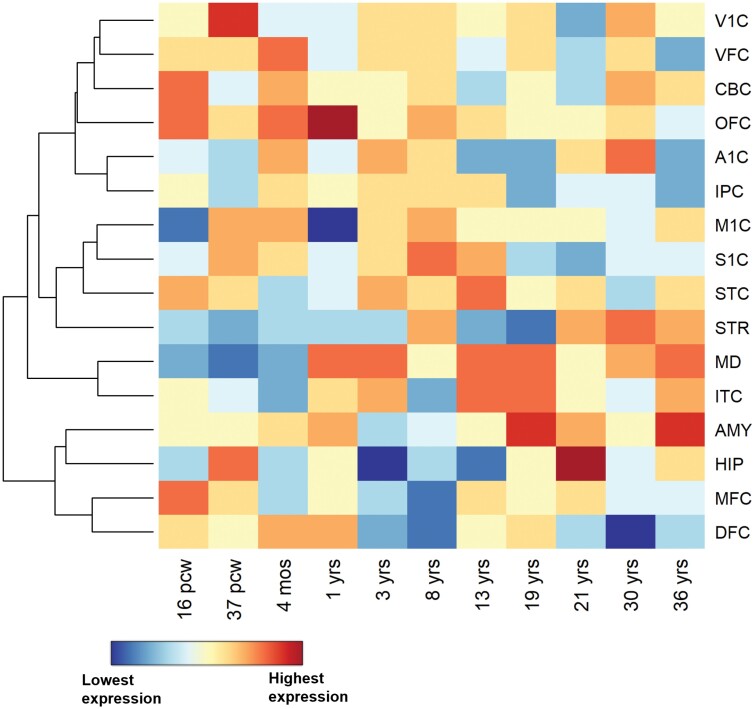
Fig. 4.
Spatiotemporal expression difference between shared genes between schizophrenia and anorexia nervosa and background genes across 16 brain regions and 11 developmental time points. The mean expression difference between 127 genes mapped to shared loci and 52 376 background genes with nonzero expression in the BrainSpan dataset is illustrated in color ranging from red (high expression) to blue (low expression). The gene expression values are log2-transformed, and the differences in transformed expression values are centered and scaled across 16 brain regions at each time point. The color represents the relative differential genetic expression in a brain region among all 16 brain regions at a specific time point. Brain regions are clustered using unsupervised hierarchical cluster analysis. Note: A1C, primary auditory cortex; ACC, anterior cingulate cortex; AMY, amygdala; CBC, cerebellum; DFC, dorsolateral prefrontal cortex; HIP, hippocampus; IPC, inferior parietal cortex; ITC, inferolateral temporal cortex; M1C, primary motor cortex; MD, mediodorsal nucleus of thalamus; MFC, medial prefrontal cortex; mos, months; OFC, orbitofrontal cortex; pcw, postconceptional weeks; S1C, primary somatosensory cortex; STC, superior temporal cortex; STR, striatum; V1C, primary visual cortex; VFC, ventrolateral prefrontal cortex; yrs, years.

