
Fig. 3. PolyQ-AR is a substrate of CDK2.
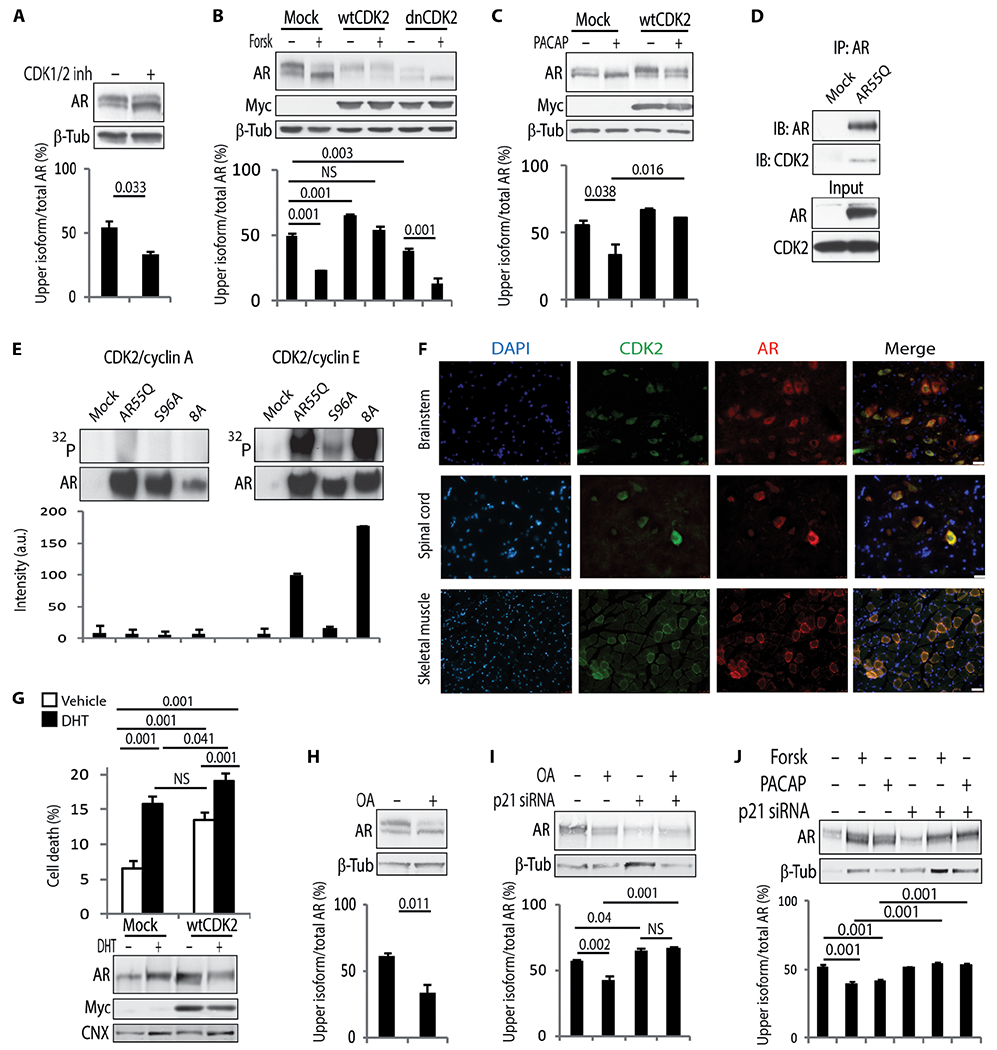
(A to C) Western blotting analysis of AR55Q in HEK293T cells either (A) treated with 30 μM CDK1/2 inhibitor (CDK1/2 inh) or (B and C) transfected with empty vector or vectors expressing Myc-tagged wtCDK2 and dnCDK2 and treated with 10 μM forskolin and 100 nM PACAP for 5 hours. n = 3 independent experiments. (D) Immunoprecipitation (IP) analysis in HEK293T cells transfected with empty vector or vector expressing AR55Q and immunoblotting (IB) analysis of AR and endogenous CDK2. Input, 10% of total protein extract. n = 3 independent experiments. (E) In vitro phosphorylation assay. AR55Q, AR55Q-S96A, and AR55Q-8A with all the (S/T)P sites substituted with alanine except for Ser96 (fig. S15A) were immunopurified from HEK293T cells and incubated with recombinant CDK2 and either cyclin A or cyclin E. Top: Autoradiography. Bottom: Western blotting analysis of AR levels. Graph, means ± SD. n = 2 independent experiments. a.u., arbitrary units. (F) Immunofluorescence analysis of polyQ-AR and CDK2 in tissues from 180-day-old AR113Q mice. Nuclei were stained with 4’,6-diamidino-2-phenylindole (DAPI). Scale bars, 25 μm (brainstem and spinal cord) and 100 μm (muscle). (G) Trypan blue assay in doxycycline-inducible PC12 cells stably expressing AR112Q, transfected with empty vector and vector expressing wtCDK2, and treated with doxycycline (10 μg/ml) and 50 μM DHT for 72 hours. Bottom: Western blotting analysis of AR and Myc-tagged wtCDK2 expression levels. n = 4 independent experiments. (H to J) Western blotting analysis of AR55Q in HEK293T cells treated with (H) 100 nM OA or (I and J) transfected with three small interfering RNAs (siRNAs) against p21Cip1 and treated with 5 nM OA, 10 μM forskolin, and 100 nM PACAP for 24 hours. n = 3 independent experiments. AR, Myc-tagged CDK2, and CDK2 were detected with specific antibodies, and β-tubulin and calnexin were used as loading control. Graphs, means ± SEM; Student’s t test (A and H), one-way ANOVA (B to C, and I and J), and two-way ANOVA (G) were used.