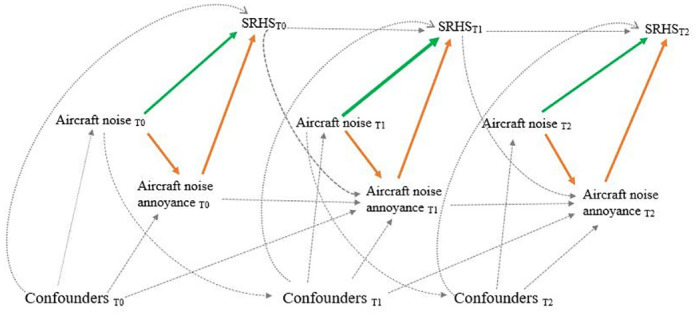
Fig 1. Causal graph with time-varying aircraft noise levels, time-varying confounders, time-varying aircraft noise annoyance and time-varying self-reported health status.

Green arrows for direct effect, orange arrows for indirect effect and dotted arrows for confounding effect. Some arrows were omitted when no direct effect from a variable on another was hypothesized.
