Figure 4.
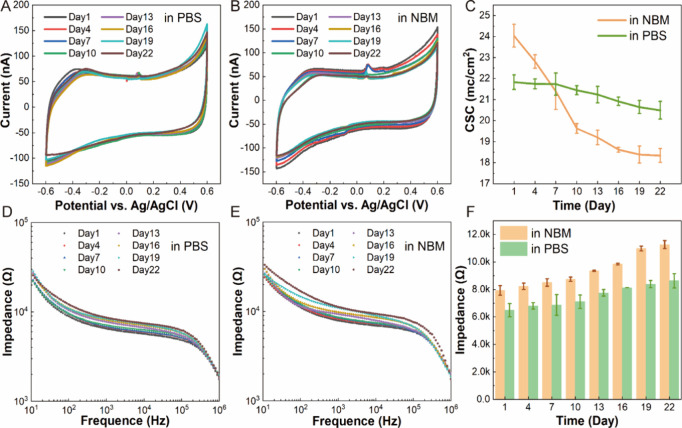
Stability characteristics of MEAs. (A) CV curves of GMμEs/PEDOT:PSS incubated in PBS. (B) CV curves of GMμEs/PEDOT:PSS incubated in NBM. (C) Time-dependent plots of CSC magnitude of GMμEs/PEDOT:PSS in PBS and NBM, showing a slight decrease over 22 days, n = 5. (D) Bode plots from EIS of GMμEs/PEDOT:PSS in PBS. (E) Bode plots from EIS of GMμEs/PEDOT:PSS in NBM. (F) Time-dependent plots of impedance magnitude of GMμEs/PEDOT:PSS at a frequency of 1 kHz, indicating a slight increase over time, n = 5.

