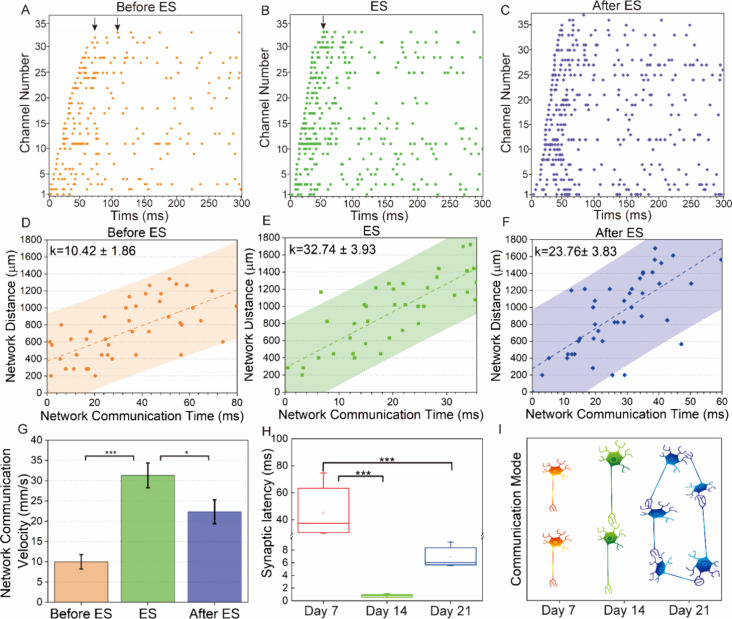
Figure 7.
Synaptic latency (SL) and network communication speed. (A–C) Time series of partial spikes in a burst of neurons before, during, and after electrical stimulation (ES). (D–F) Scatter plot of network distance to all firing sites from the first firing site depending on network communication time before, during, and after electrical stimulation. The dotted line and shaded area represent the best fit of linear regression and the 95% confidence level, respectively. The slope of the linear regression denotes the network communication velocity. (G) Bar graph displaying the network communication velocity across the before, during, and after electrical stimulation states, n = 5, *p < 0.05, *** p < 0.001. Note, data distribution is included in Figure S10-2. (H) Box-plots illustrating changes in synaptic latency (SL) across days in vitro, n = 3, *** p < 0.001. Note, data distribution is included in Figure S11-2. (I) Plot depicting the communication connectivity mode across days in vitro.

