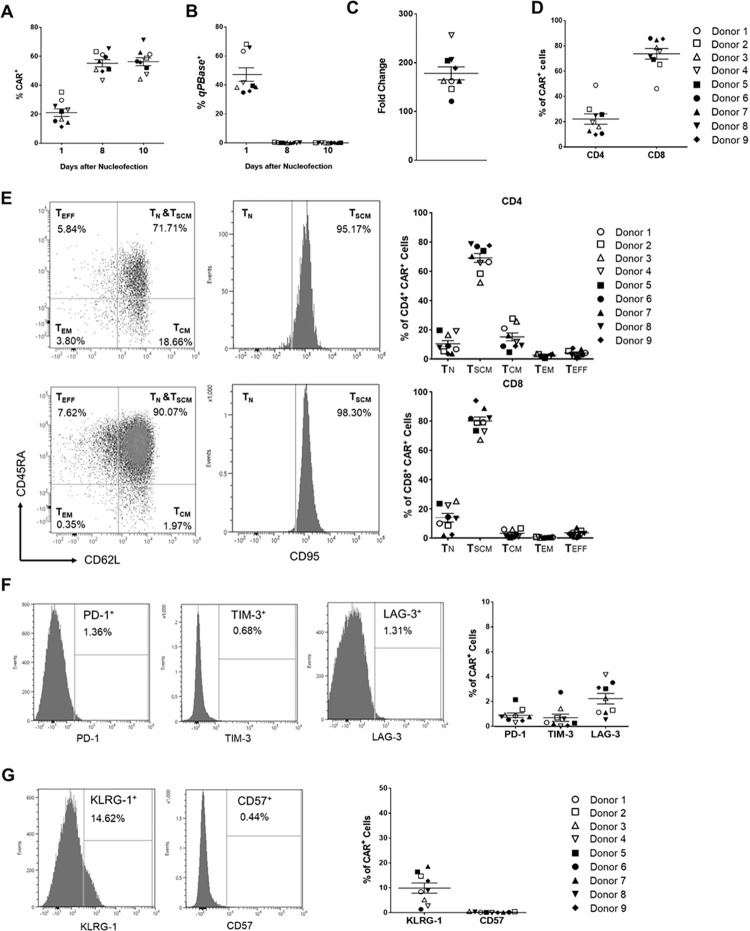
Fig 2. Characteristics of CARiC9-20/19 CAR-T cells.
Percentages of (A) CAR+ and (B) transposase+ (qPBase+) cells were analyzed by flow cytometry on days 1, 8 and 10 after nucleofection. (C) Fold change of CARiC9-20/19 CAR-T cells after 10 days of culture in G-Rex are shown. (D) Percentage of CD4 and CD8 T cells in the CAR+ population on day 10 after nucleofection. (E) Distributions of TN, TSCM, TCM, TEM, and TEFF subsets in the CD4 (upper panel) and CD8 populations (lower panel). (F) Expression of exhaustion markers PD-1, TIM-3, and LAG-3 in CARiC9-20/19 CAR-T cells at 10 days post-nucleofection. (G) Expression of senescence markers KLRG-1 and CD57 in CARiC9-20/19 CAR-T cells. (A-G) Data represent mean ± SD for 9 healthy donors, n = 9. Each set of histogram plots shown in (C), (D), (E), and (F) represents one donor.

