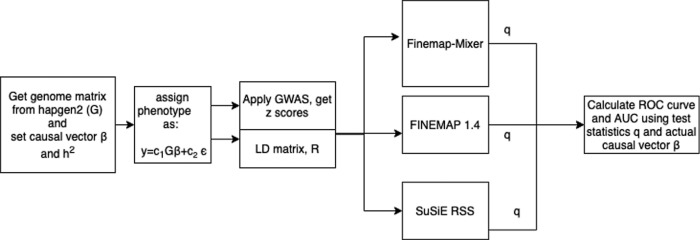
Fig 1. Overview of the steps used for validation of the Finemap-MiXeR method with synthetic data.
Firstly, we randomly selected a locus containing pre-defined number (M) of adjacent SNPs, randomly selected “k” causal variants within the loci, and draw their effect sizes (vector β). Then, we used synthetic genotype data (G) with realistic LD structure, as generated by hapgen2 tool, to calculate the phenotypic values (y) for all individuals using additive genetic model (y = c1Gβ+c2ϵ), where scaling constants c1 and c2 were chosen to yield Var(y) = 1 and Var(c1Gβ) = h2 (pre-defined value indicating true heritability of the loci). Using G and y we calculated z-scores by applying GWAS, and then used them as inputs for the tools to obtain posterior causal probabilities of each SNP. Since we know ground truth (the location of causal variants), we then determined Receiver Operating Characteristic (ROC) curves for Finemap-MiXeR and the comparison methods (SuSiE RSS and FINEMAP 1.4) and calculated corresponding Area Under the Curve (AUC).

