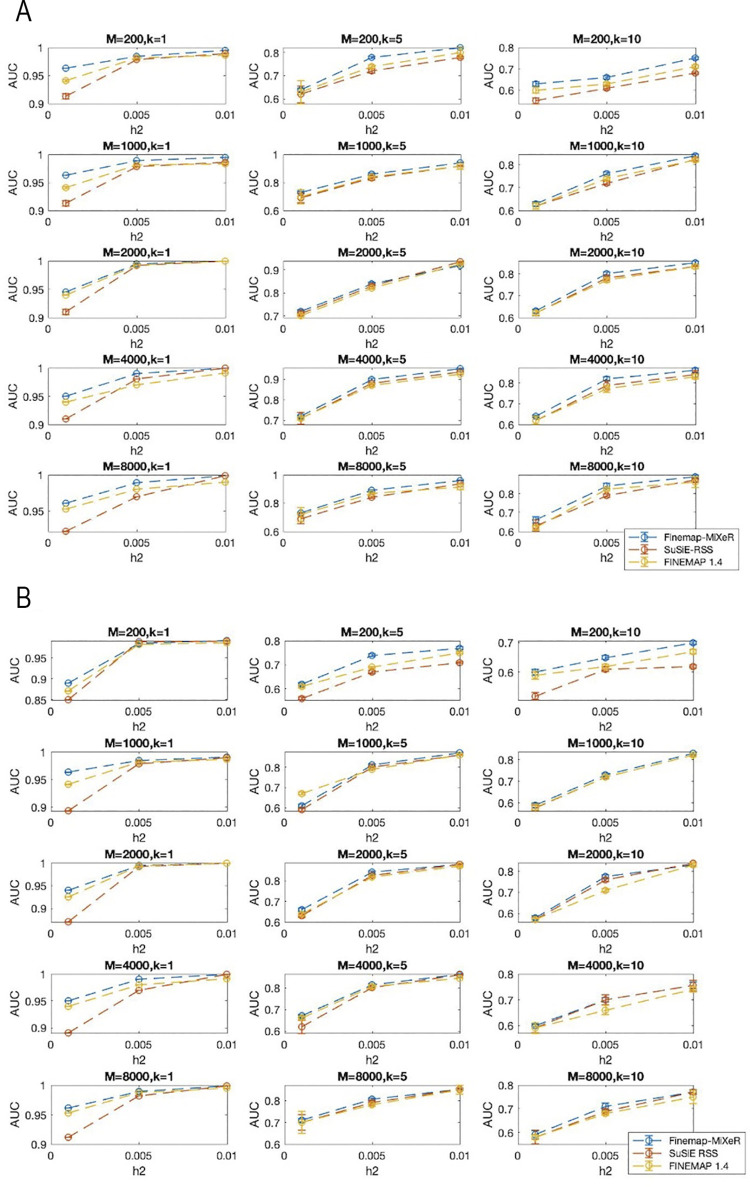
Fig 2.
(A) Area Under the ROC Curve (AUC) comparison of Finamep-MiXeR with SuSiE RSS and FINEMAP across different scenarios, varying: the size of the locus being analyzed (M = 200, 1000, 2000, 4000, or 8000 SNPs per locus, shown in rows); the true number of causal variants (k = 1, 5, or 10, shown in columns), and the true heritability within the locus (h2 = 0.001, 0.005, or 0.01, shown on the horizontal axis of each panel). Effect size of causal SNPs are randomly assigned as βi = 1 and then adjusted based on given heritability. The curves represent Receiver Operating Characteristic (ROC) curve averaged across 50 different simulations with corresponding standard error. (B) Area Under the ROC Curve (AUC) comparison of Finamep-MiXeR with SuSiE RSS and FINEMAP across different scenarios, varying: the size of the locus being analyzed (M = 200, 1000, 2000, 4000, or 8000 SNPs per locus, shown in rows); the true number of causal variants (k = 1, 5, or 10, shown in columns), and the true heritability within the locus (h2 = 0.001, 0.005, or 0.01, shown on the horizontal axis of each panel). Effect size of causal SNPs are randomly assigned by βi = N(0,1) and then adjusted based on given heritability. The curves represent Receiver Operating Characteristic (ROC) curve averaged across 50 different simulations with corresponding standard error.

