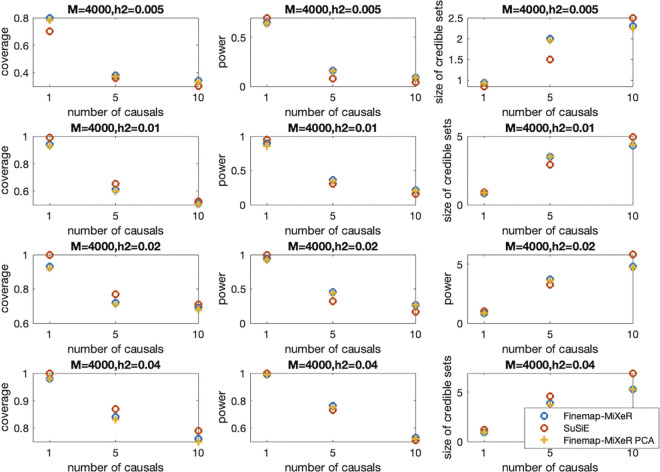
Fig 3. Credible Sets coverage and power comparison of Finamep-MiXeR and SuSiE across different scenarios, varying the true number of causal variants (k = 1, 5, or 10, shown in columns), and the true heritability within the locus (h2 = 0.005, 0.01, 0.02 or 0.04, shown on the horizontal axis of each panel) with M = 4000 SNPs (the size of the locus being analyzed).
The effect sizes of causal SNPs are randomly assigned by βi = N(0,1) and then adjusted based on the given heritability. The first column corresponds to coverage, which is the probability of a credible set to include at least one causal SNP (and it is equivalent to 1-False Coverage Rate), while the second column gives the corresponding power, i.e. the total proportion of causal SNPs detected by all reported credible sets. The third column gives the average size (number of variants) in credible sets. η is chosen as 0.5 and qthr = 0.95, both as suggested in SuSiE.

