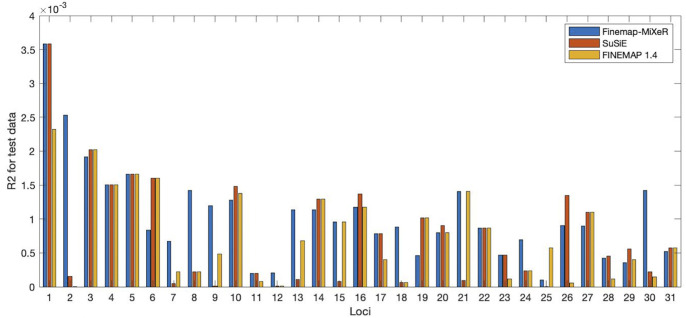
Fig 4. R2 comparison of Finemap-MiXeR with SuSiE and FINEMAP for 31 different loci for UKB height analysis.
The details of loci are given in Table A in S1 Text. R2 values corresponds to the correlation between estimated phenotype of test data using the three methods and actual test data. Tools are applied on training data and SNP with highest posterior causal probability were obtained. Then this SNPs is used to estimate test phenotype data. There were 9 loci (29%) [2,7–9,12,13,17,23,29] where Finemap-MiXeR obtained substantially higher R2 than both of the other methods. For 16 loci (51%) [1,3–5,7,10,11,14–16,19–22,27,30], Finemap-MiXeR obtained best (or quite close to the best) R2 results as one or both of the other methods. There were only 6 loci [6,18,24–26,28] where one of the other methods were better than Finemap-MiXeR, with two loci (6%) [25,28] for SuSiE and one locus (3%) [24] for FINEMAP and three locus for both [6,18,26].

