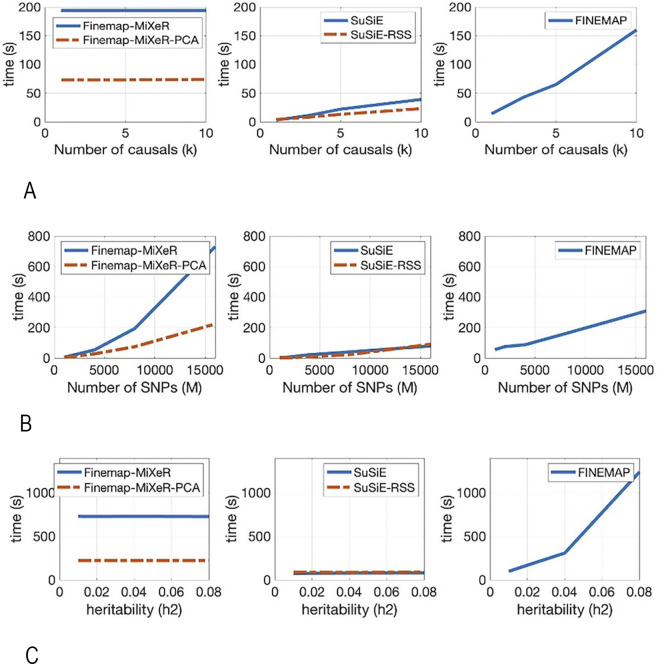
Fig 6. Runtime comparison (in seconds) of the three methods (Finemap-MiXeR, SuSiE, FINEMAP) and two modifications (Finemap-MiXeR-PCA and SuSiE-RSS).
Note that these figures are obtained using the synthetic data described in “Simulation with Synthetic data” section. First row of figures: varying size of number of causals from 1 to 10 while keeping constant M and h2. Second row of figures: varying size of the locus M from 1000 to 16000 while keeping constant true heritability (h2 = 0.04) and true number of causals (k = 10). Third row of figures: varying size of the true h2 while keeping M = 16000 and k = 10 as constant. (A) Computational performance on varying size of number of causals(k) from 1 to 10 while keeping M and h2 as constant. (B) Computational performance on varying size of the locus (M) from 1000 to 16000 while keeping h2 and k as constant. (C) Computational performance on varying size of the true h2 from 0.01 to 0.08 while keeping M and k as constant.

