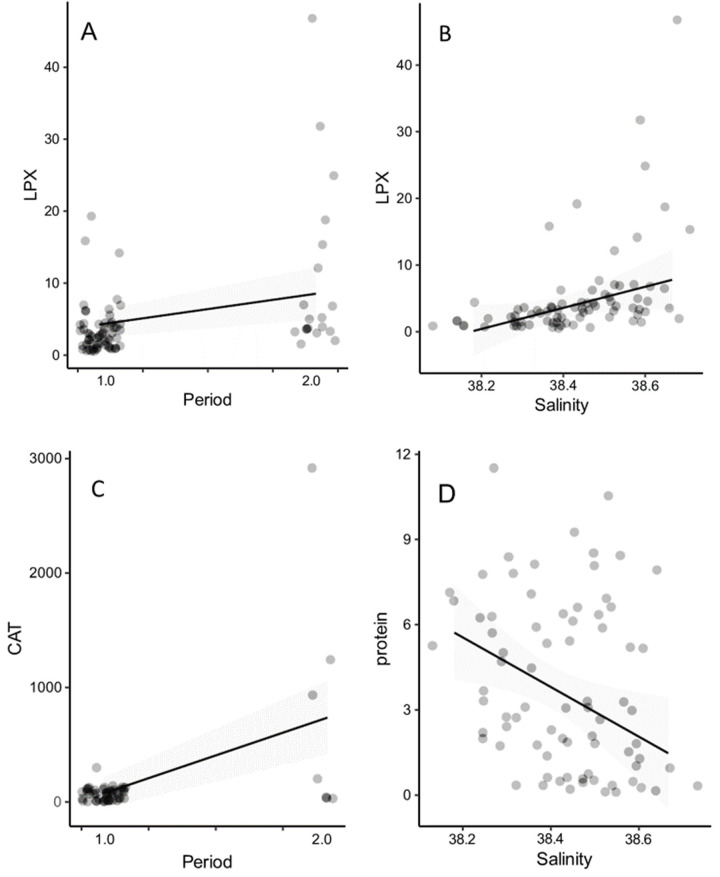
Fig 6. Biomarker enzymes measured from >200 um plankton community during heatwave experiment in Control C and Treatment T, consisting of 10 days heatwave following 10 days of post-heatwave.
A) Lipid peroxidation (LPX), FOX mg protein-1 during Period 1 (Heatwave) and Period 2 (Post-heatwave), and B) LPX as a relationship with salinity, C) catalase (CAT) μmol min-1 mg-1, as well as D) protein mg-1 against increasing salinity. FOX = ferrous oxidation ‐ xylenol orange. Note salinity scale in Fig B and D.

