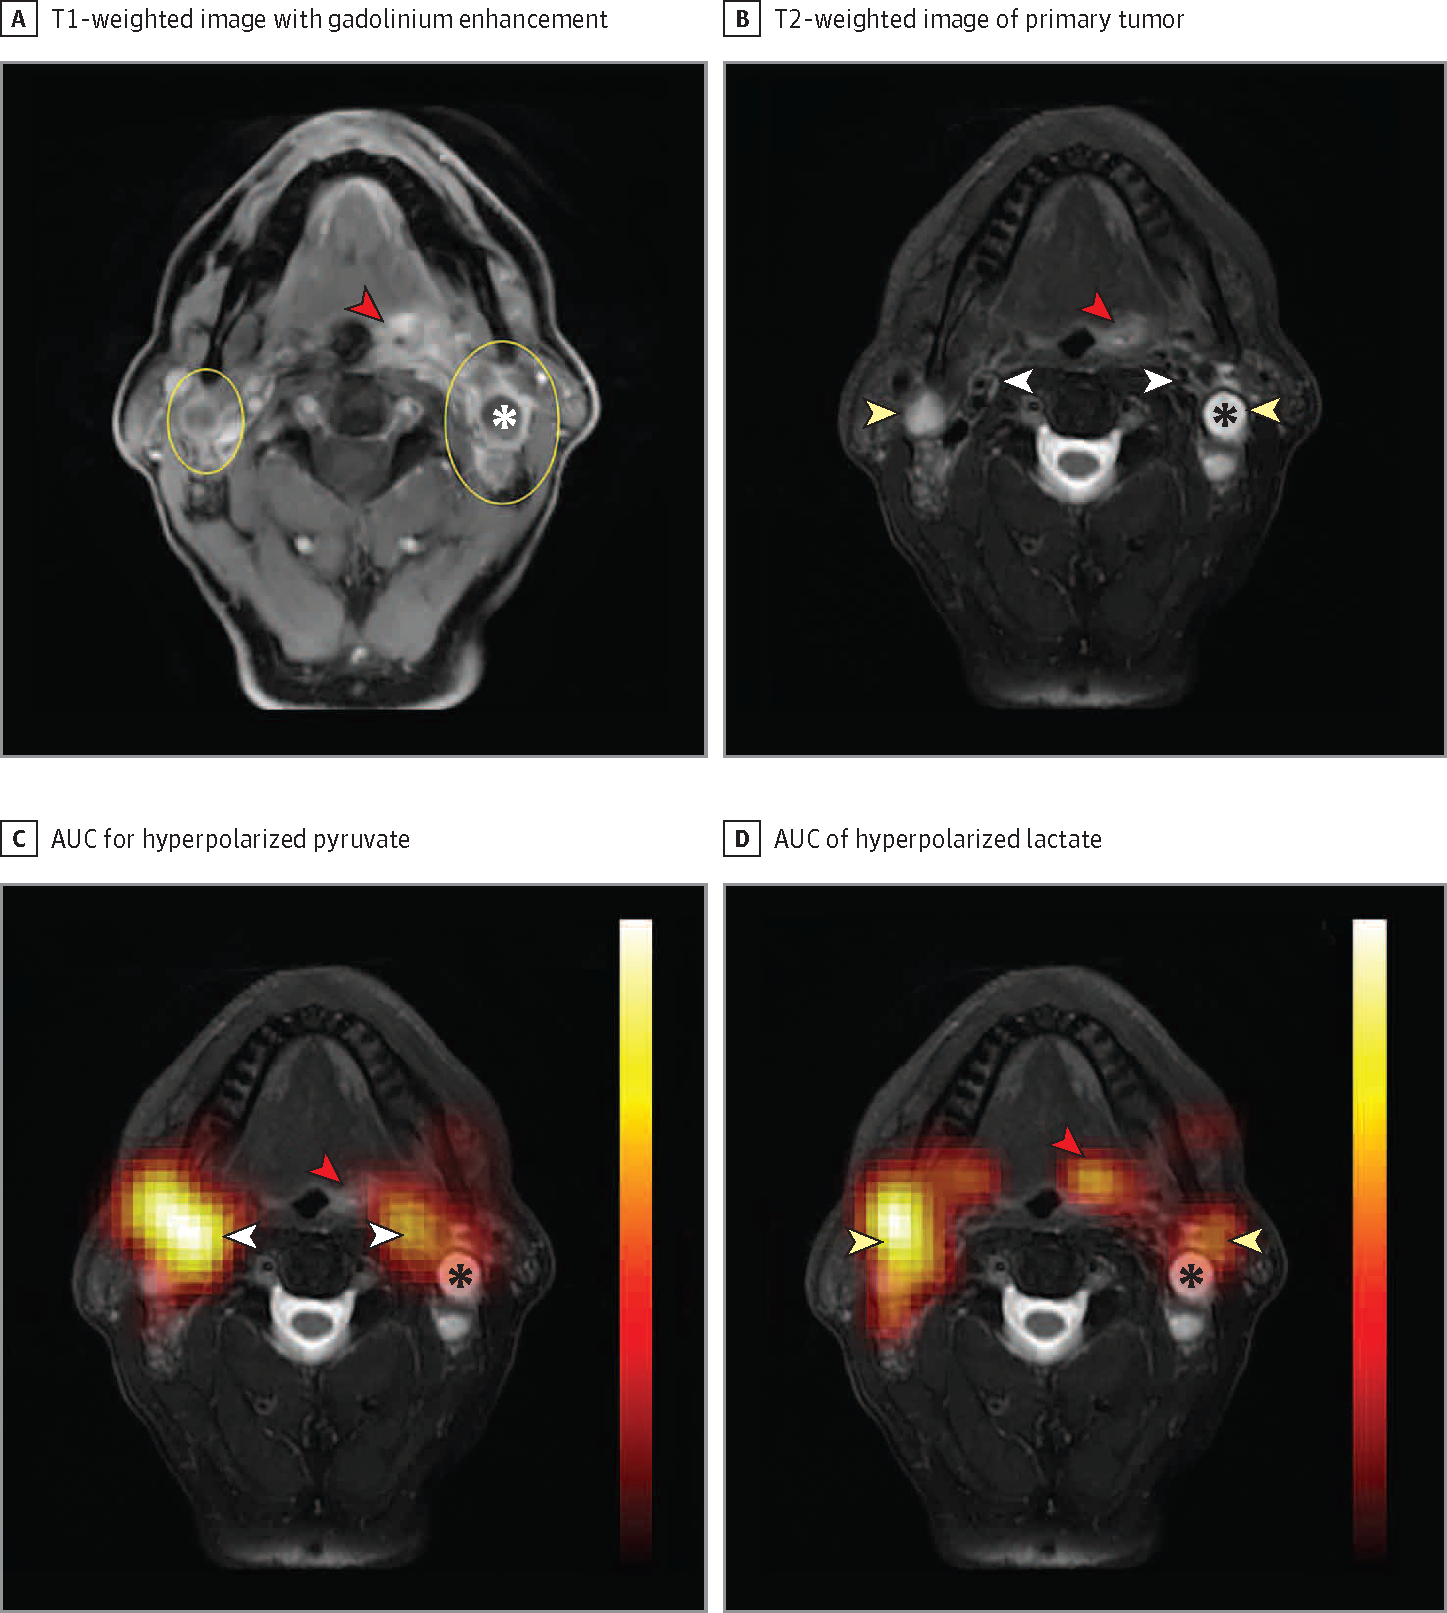
Figure 1. Tongue Base Carcinoma With Bilateral Upper Neck Lymphadenopathy.

A, T1-weighted image with gadolinium enhancement showing the primary tumor (red arrowhead) and bilateral neck lymphadenopathy (yellow ovals). B, The primary tumor (red arrowhead) and bilateral metastatic lymph nodes (yellow arrowheads) are again indicated on T2-weighted images. We also show the vasculature (white arrowheads) anteromedial to the metastatic lymph nodes. C, Area under the dynamic signal curve (AUC) measurements for hyperpolarized pyruvate superimposed over the T2-weighted anatomic reference shows pyruvate signal to strongly localize over the vasculature (white arrowheads), with relatively little pyruvate signal over the primary tumor (red arrowhead) and metastatic lymph nodes. D, AUC of hyperpolarized lactate superimposed on the T2-weighted anatomic reference shows strong localization of the lactate over the metastatic lymph nodes (yellow arrowheads) with decreased signal over the vasculature and strong signal over the primary tumor (red arrowhead). The apparent shift in signal from the vasculature on pyruvate images to the lymph nodes and primary tumor on lactate images reflects the conversion of lactate from hyperpolarized pyruvate. Lactate dehydrogenase and other enzymes that mediate this conversion are frequently upregulated in head and neck squamous cell carcinoma and in many other cancers. Note the relative paucity of lactate signal over the major necrotic portion of the left-sided neck lymph node (asterisk). In the absence of enzymes in necrotic tissue, no conversion takes place. Hyperpolarized overlays (1.5-cm thickness and resolution) are interpolated for display. Additional anatomic reference images that overlap with the hyperpolarized magnetic resonance imaging slice and dynamic signal series are available.6
