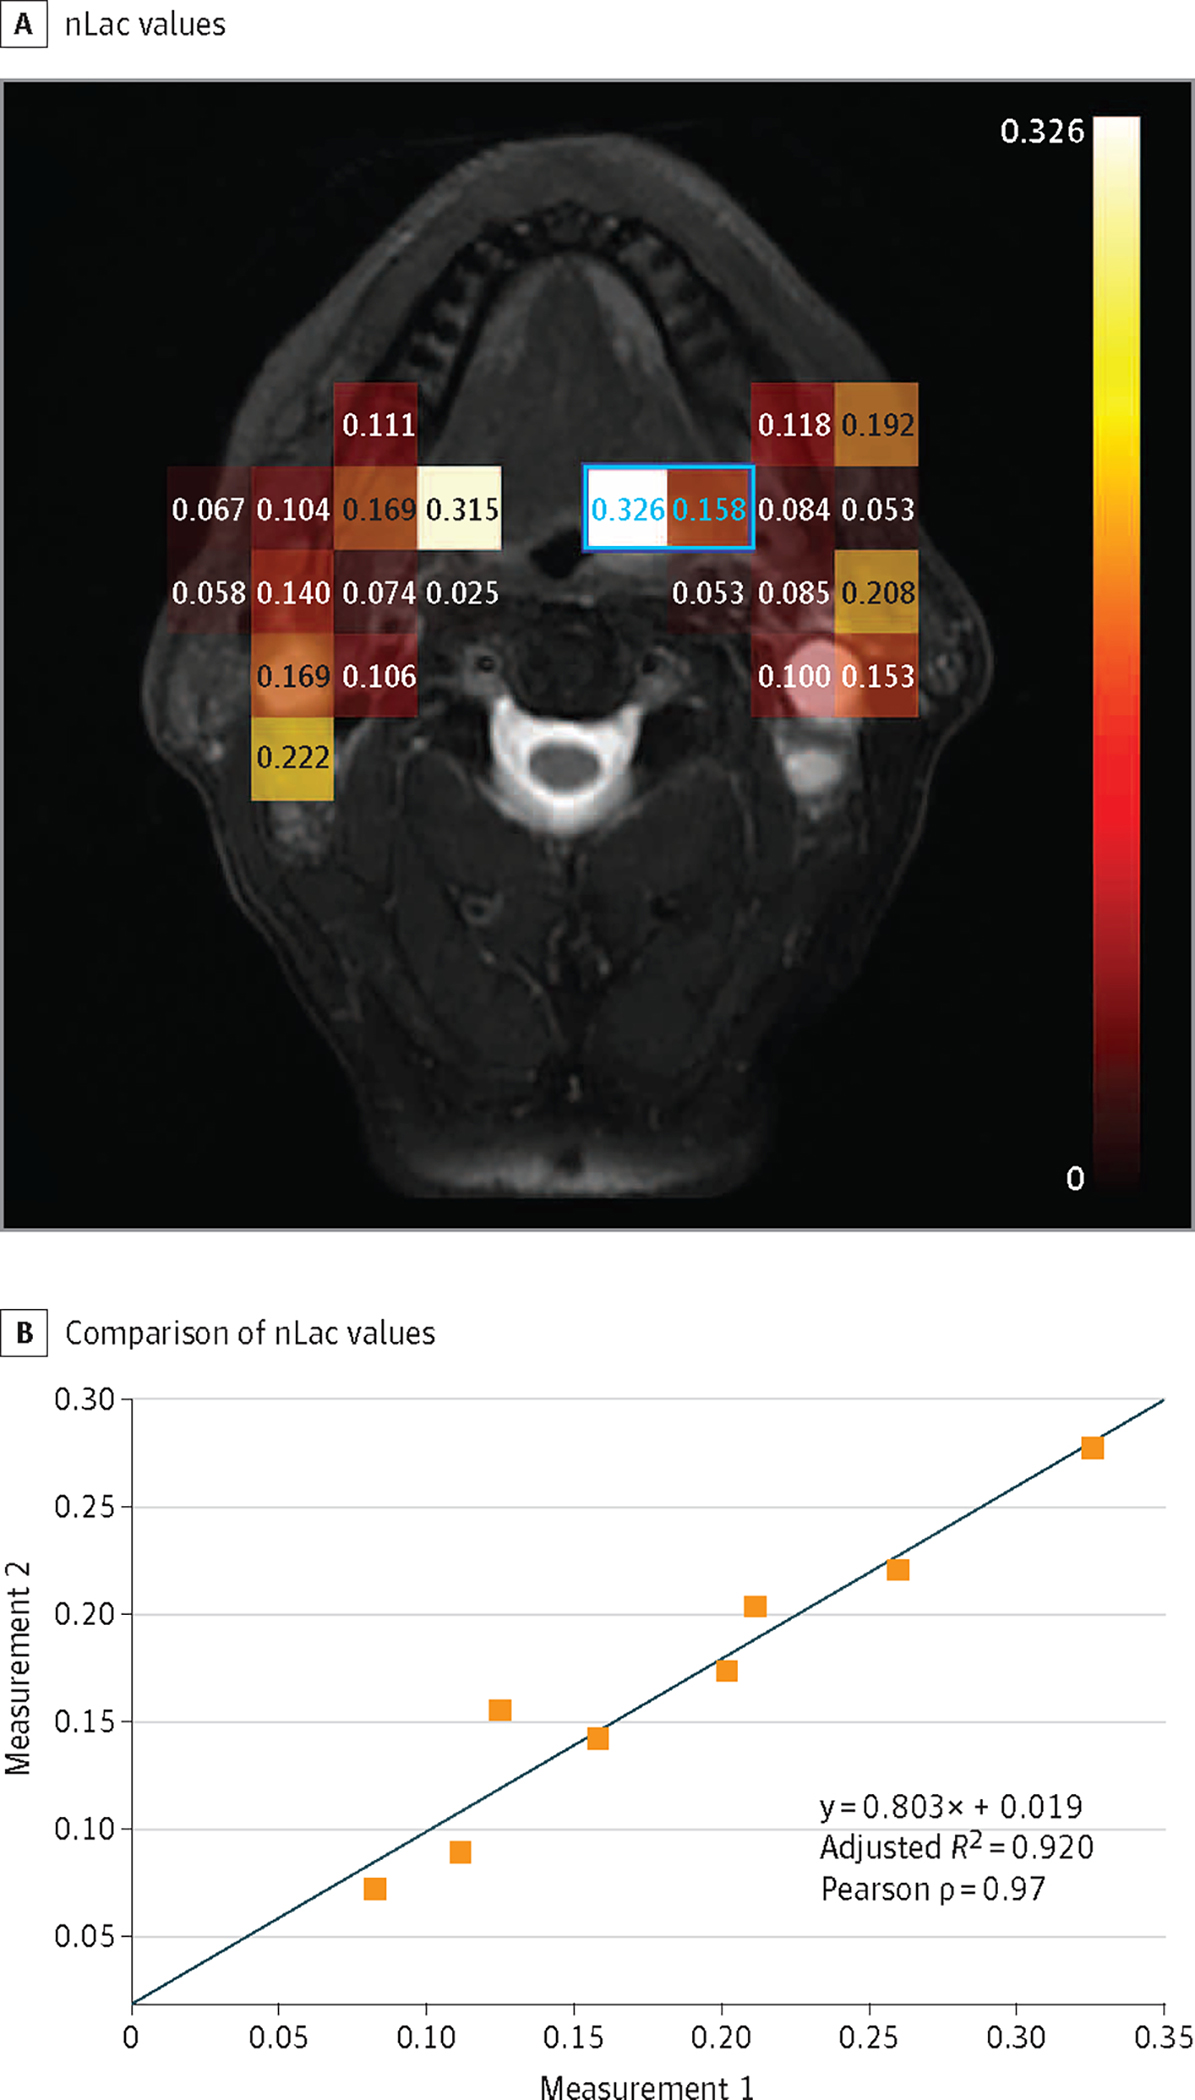
Figure 2. Normalized Lactate Ratio (nLac) as a Reproducible Semiquantitative Imaging Biomarker for Tumor Metabolism.

nLac is calculated as the ratio of the area under the dynamic signal curve (AUC) for lactate to the AUC of the total hyperpolarized carbon 13 signal (pyruvate plus lactate). A, nLac values are calculated for each voxel in which the total hyperpolarized 13C signal-to-noise ratio exceeds 10:1. B, Comparison of nLac values from serial observations of tumor-containing voxels (at least 30% by cross-section as judged from anatomic images) within a single imaging session but separated by approximately 40 minutes. The Pearson correlation coefficient shows very strong correlation (ρ = 0.97; P < .001) between repeated measurements within 8 voxels captured across all slices (2 such voxels are indicated by blue outline and values). While the line of identity is within the confidence intervals of this regression, further study is warranted to determine if a slope of less than unity reflects a transient saturation of pyruvate uptake or metabolism.
