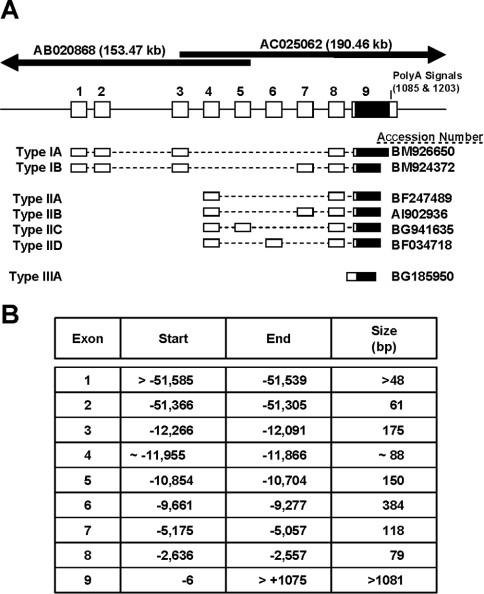
Figure 1. Genomic organization of the human NAT1 gene deduced from the EST database.
(A) Summary of the intron–exon organization and the seven different splice variants that were identified in the database. The mRNAs are grouped according to the first exon used. The overlapping sequences that contain the entire NAT1 gene are depicted at the top of the Figure. (B) The Table lists the first and last base for each exon relative to the translation start site. The size of each exon is also shown.

