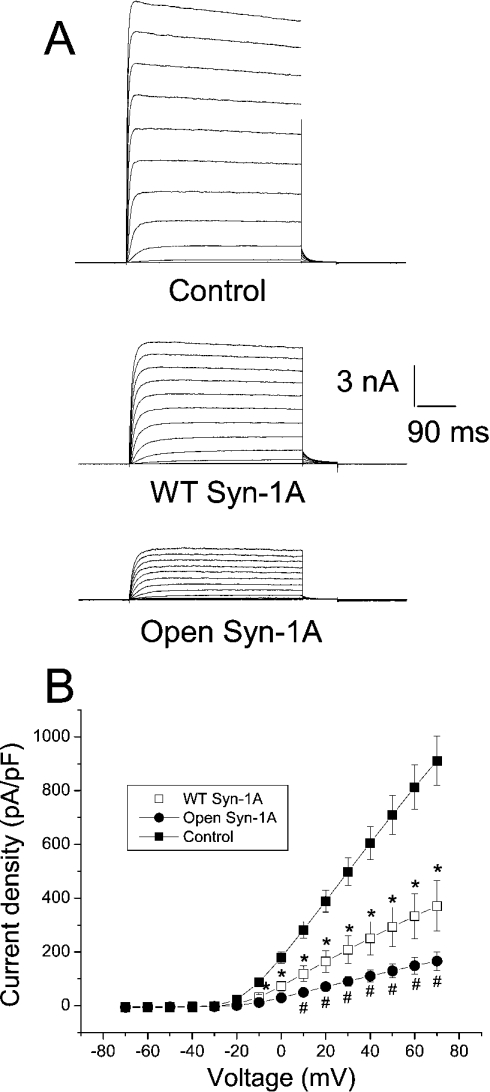
Figure 1. Open form Syn-1A decreased the current density of Kv2.1 to a greater extent than WT Syn-1A.
(A) Representative traces showing outward K+ currents triggered by a series of pulses (from −70 to +70 mV, 500 ms) from a holding potential of −70 mV in HEK-293 cells expressing Kv2.1 alone, Kv2.1 with WT Syn-1A or Kv2.1 with the open form of Syn-1A. (B) Quantitative summary of (A). Currents were normalized by cell capacitance to yield the current density. Results are means±S.E.M. for 13–22 cells. *Significantly (P<0.05) lower than control; # significantly (P<0.05) lower than control and WT Syn-1A.

