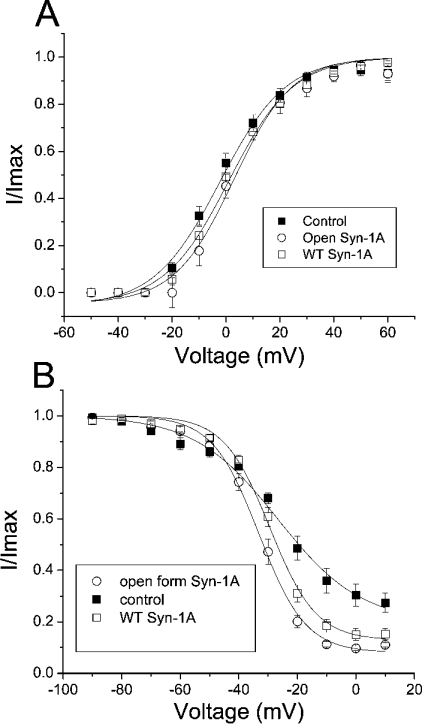
Figure 6. Open form Syn-1A caused a left-shift in the steady-state inactivation curve of Kv2.1 but had no effect on the voltage dependence of activation.
(A) Instantaneous activation curves. Voltage steps from −50 to +60 mV (500 ms) delivered in 10 mV increments from a holding potential of −70 mV were followed by a −40 mV step to trigger tail currents. Normalized peak tail currents are then plotted against the various voltage steps. The curves are best fit by the Boltzmann equation. Neither WT nor the open form of Syn-1A significantly affected the voltage dependence of activation. Results are means±S.E.M. for 7–10 cells. (B) Steady-state inactivation experiments. A dual-pulse method was used in which a test pulse step of +70 mV was preceded by a long pre-pulse (12 s) of different potentials. The test pulse currents are normalized to the largest test pulse current and plotted against the pre-pulse voltages. The curves are best fit by the Boltzmann equation. Both syntaxins significantly decreased the slope factors while only open form Syn-1A caused a significant left-shift in V1/2 (see the Results section for details). Results are means±S.E.M. for 7–8 cells.

