Figure 3.
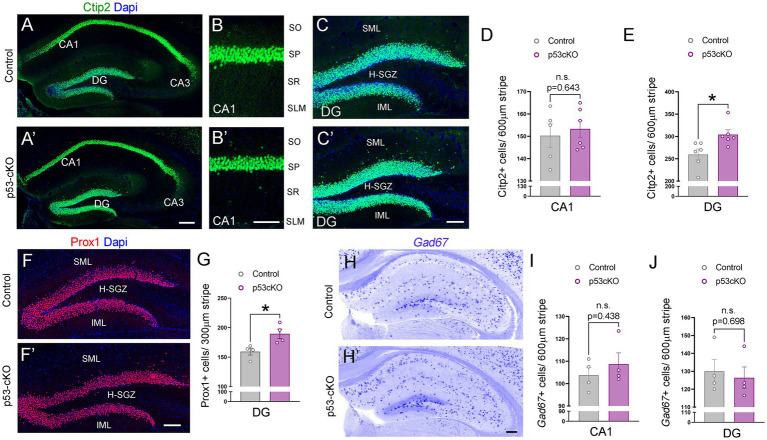
Increased granule cell density in p53-cKO hippocampus. (A) Immunofluorescence for Ctip2 in coronal sections at the level of the hippocampus of control and p53-cKO mice at P60. (B,B′) Magnification of the CA1 region depicting Citp2-positive cells in control (B) and p53-cKO mice (B′). (C,C′) Magnification of the DG depicting Citp2-positive cells in control (C) and p53-cKO mice (C′). (D,E) Quantification of Ctip2 density in the CA1 region (D) and DG (E). (F,F′) Immunofluorescence for Prox1 on coronal sections at the level of the DG of control and p53-cKO mice at P60. (G) Quantification of Prox1 positive cells density in the DG (H,H′) Hippocampal coronal sections hybridized with Gad67 riboprobe in control (F) and p53-cKO mice (F′). (I,J) The mean density of Gad67-positive neurons in the CA1 region (G) and DG (H). DG, dentate gyrus; SO, stratum oriens; SP, stratum pyramidale; SR, stratum radiatum; SLM, stratum lacunosum-moleculare; SML, superior molecular layer; IML, inferior molecular layer; H-SGZ, Hilus-subgranular zone. Values were obtained by unpaired Student’s t-test; *p < 0.05, **p < 0.01, and ***p < 0.001. Scale bar (A’,H′) 200 μm (B′,C′,F′) 100 μm.

