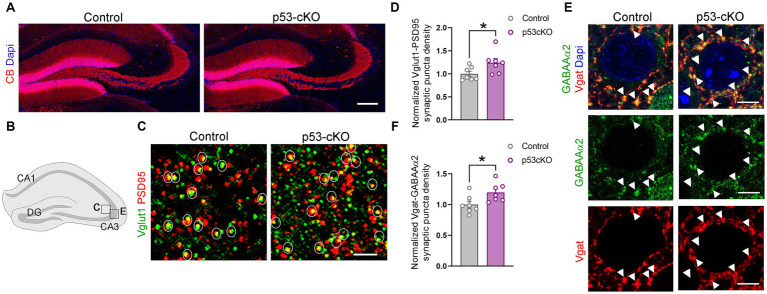
Figure 5.
p53-cKO mice present an increase in glutamatergic and GABAergic synapses in the CA3 region. (A) Immunofluorescence for Calbindin (CB) in coronal sections at the level of the hippocampus of control and p53-cKO mice at P60 labeling the granule cells of the dentate gyrus. (B) Schematic illustration of a hippocampus showing the regions where the pictures were taken. (C) Immunofluorescence for Vglut1 and PSD95 in the stratum lucidum of the CA3 region. Circles delineated the synaptic puncta (colocalization between Vglut1 and PSD95). (D) Quantification of the density of glutamatergic synaptic puncta in the CA3 region of control and p53-cKO mice (Ctrl: 1 ± 0.06, n = 7; p53-cKO: 1.24 ± 0.09, n = 7). (E) Immunofluorescence for GABAAα2 and Vgat in the stratum pyramidale of the CA3 region. Arrowheads indicate the GABAergic synaptic puncta (colocalization between GABAAα2 and Vgat). (F) Quantification of the density of GABAergic synaptic puncta in the CA3 region of control and p53-cKO mice (Ctrl: 1 ± 0.06, n = 7; p53-cKO: 1.2 ± 0.06, n = 7). DG, dentate gyrus. Values were obtained by unpaired Student’s t-test; *p < 0.05, **p < 0.01, and ***p < 0.001. Scale bar (A) 200 μm, (C) 2 μm, (E) 5 μm.

